California Current Integrated Ecosystem Assessment

The Ecosystem Context for Reducing West Coast Whale Entanglements

Why do whales become entangled in fishing gear, and can we minimize these events?

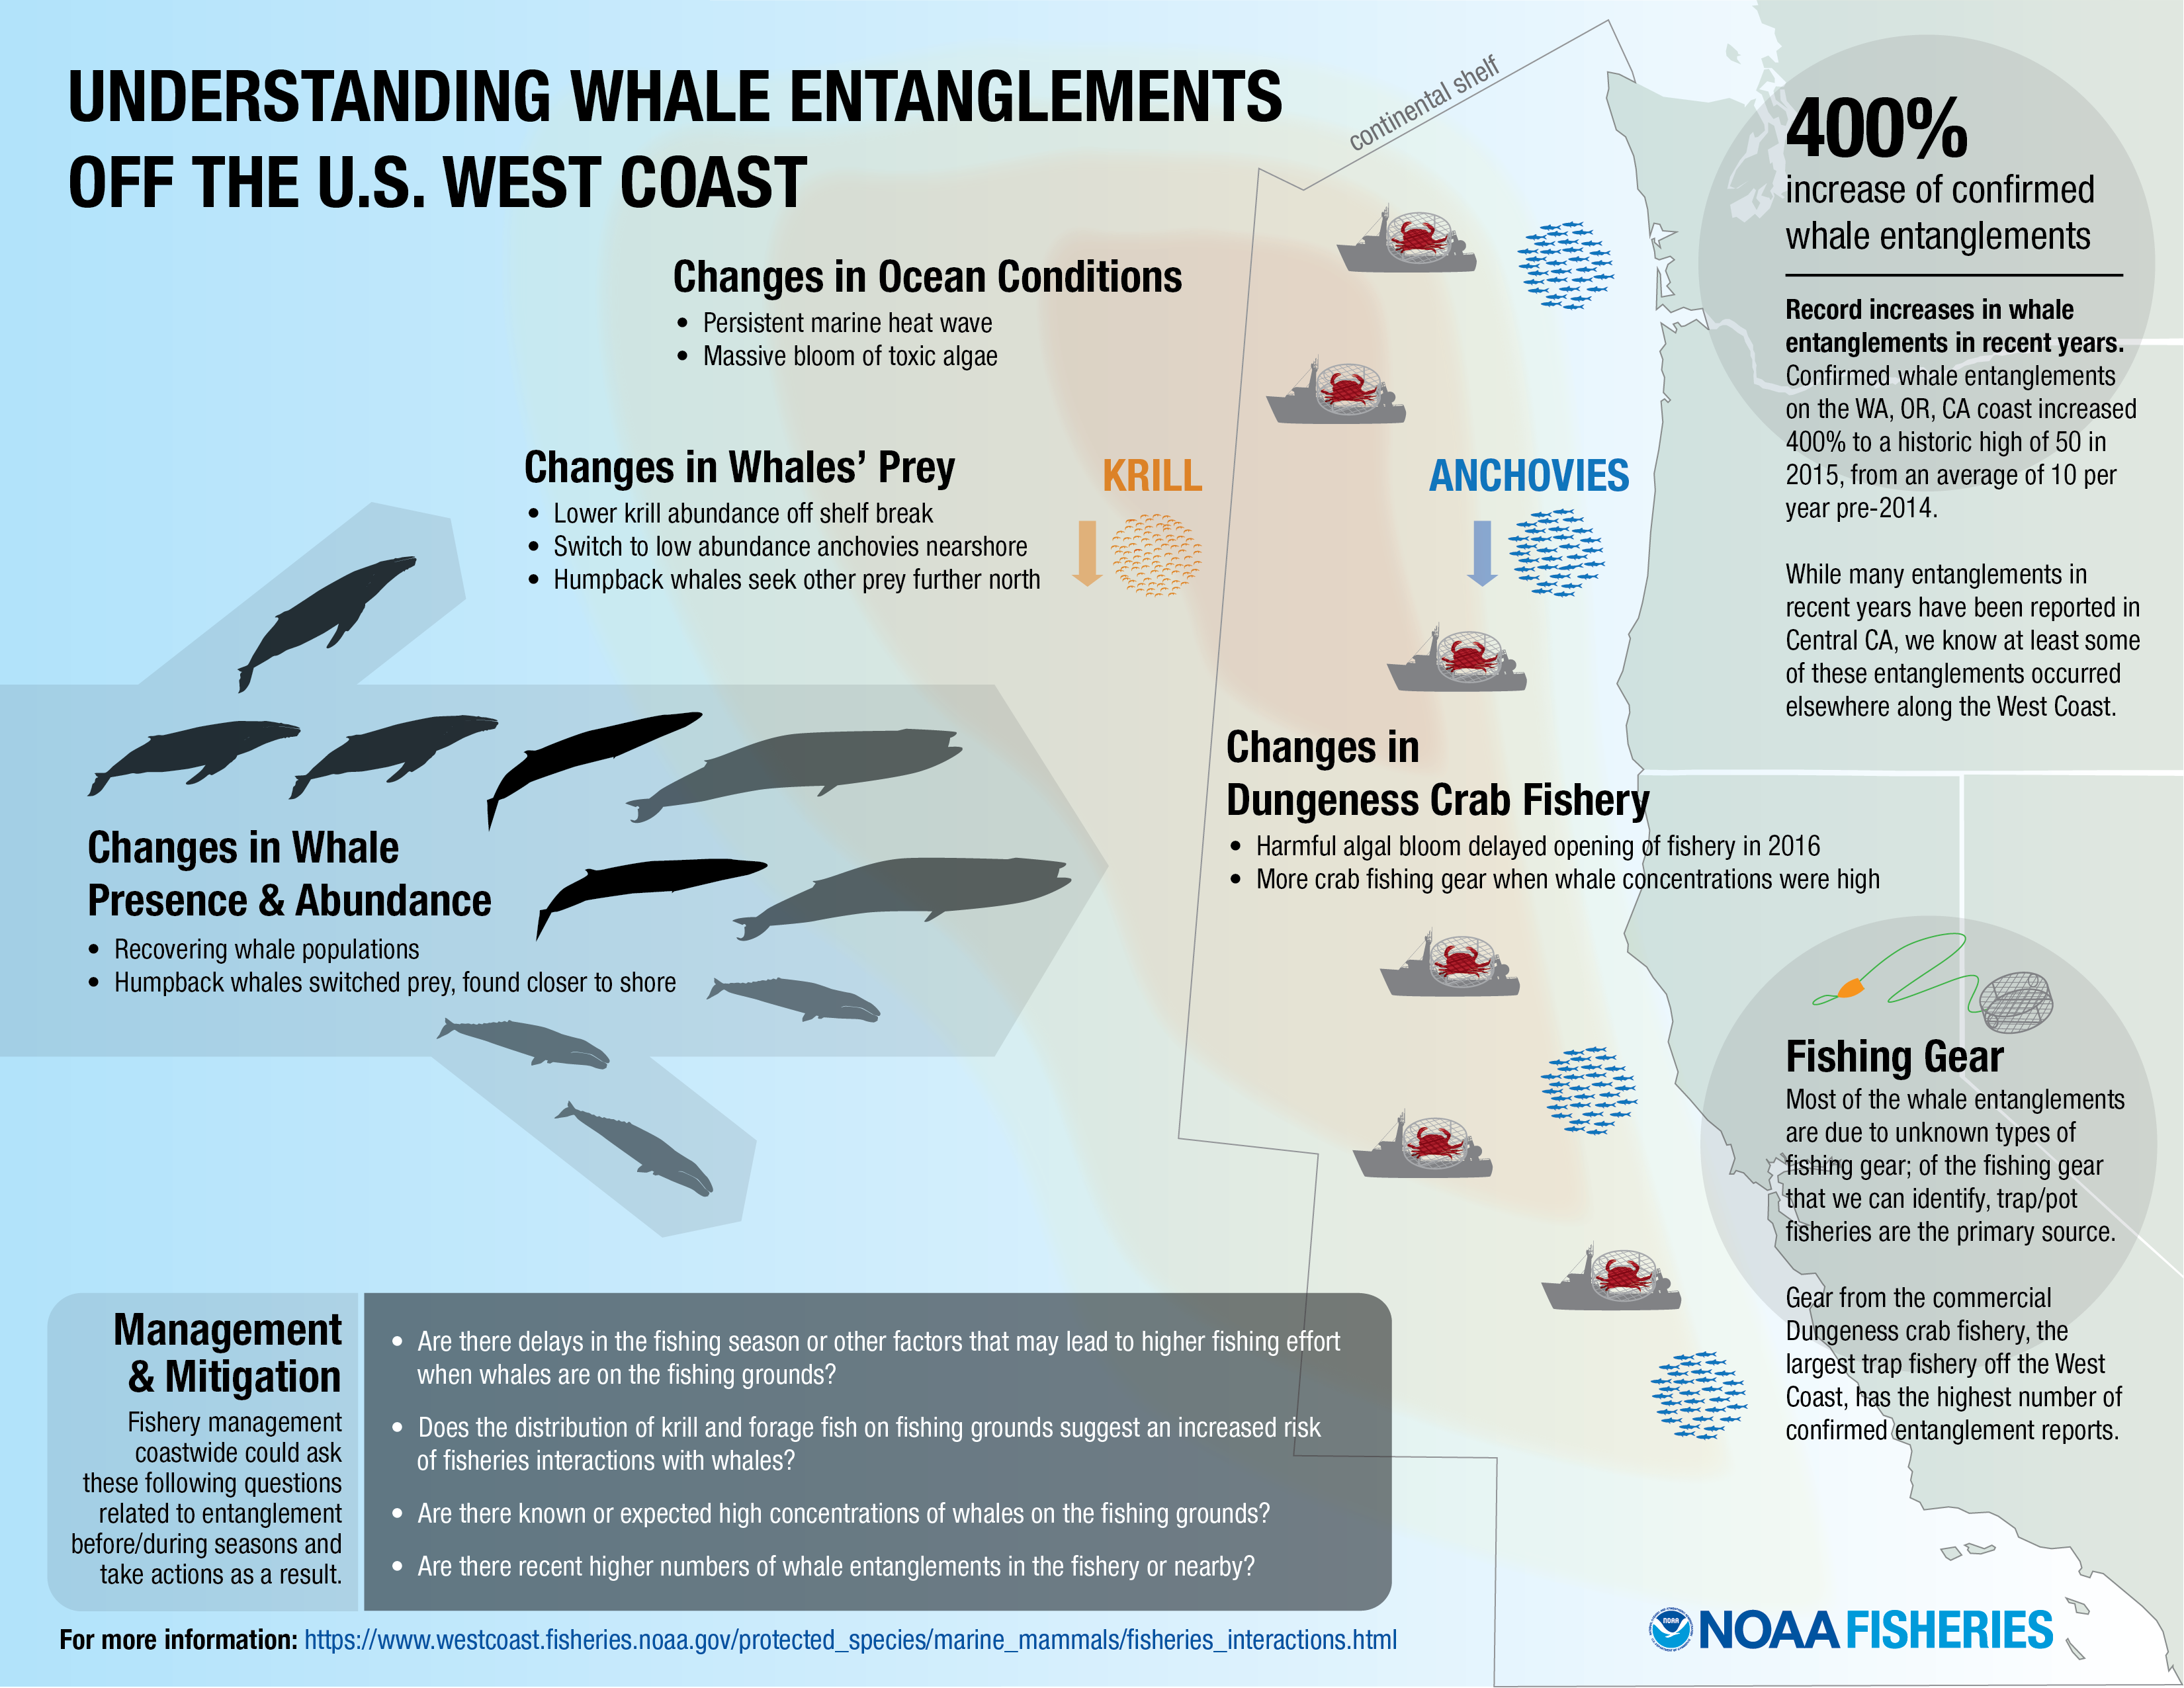
The number of large whale entanglements confirmed by NOAA Fisheries has increased off the U.S. West Coast in recent years. This alarming pattern has mobilized efforts to understand and address factors that contribute to whale entanglement in fishing gear (Figure 1). NOAA Fisheries is responsible for recovering and protecting these whales under the Marine Mammal Protection Act and Endangered Species Act. The states are responsible for managing many of the fisheries that interact with these whales.

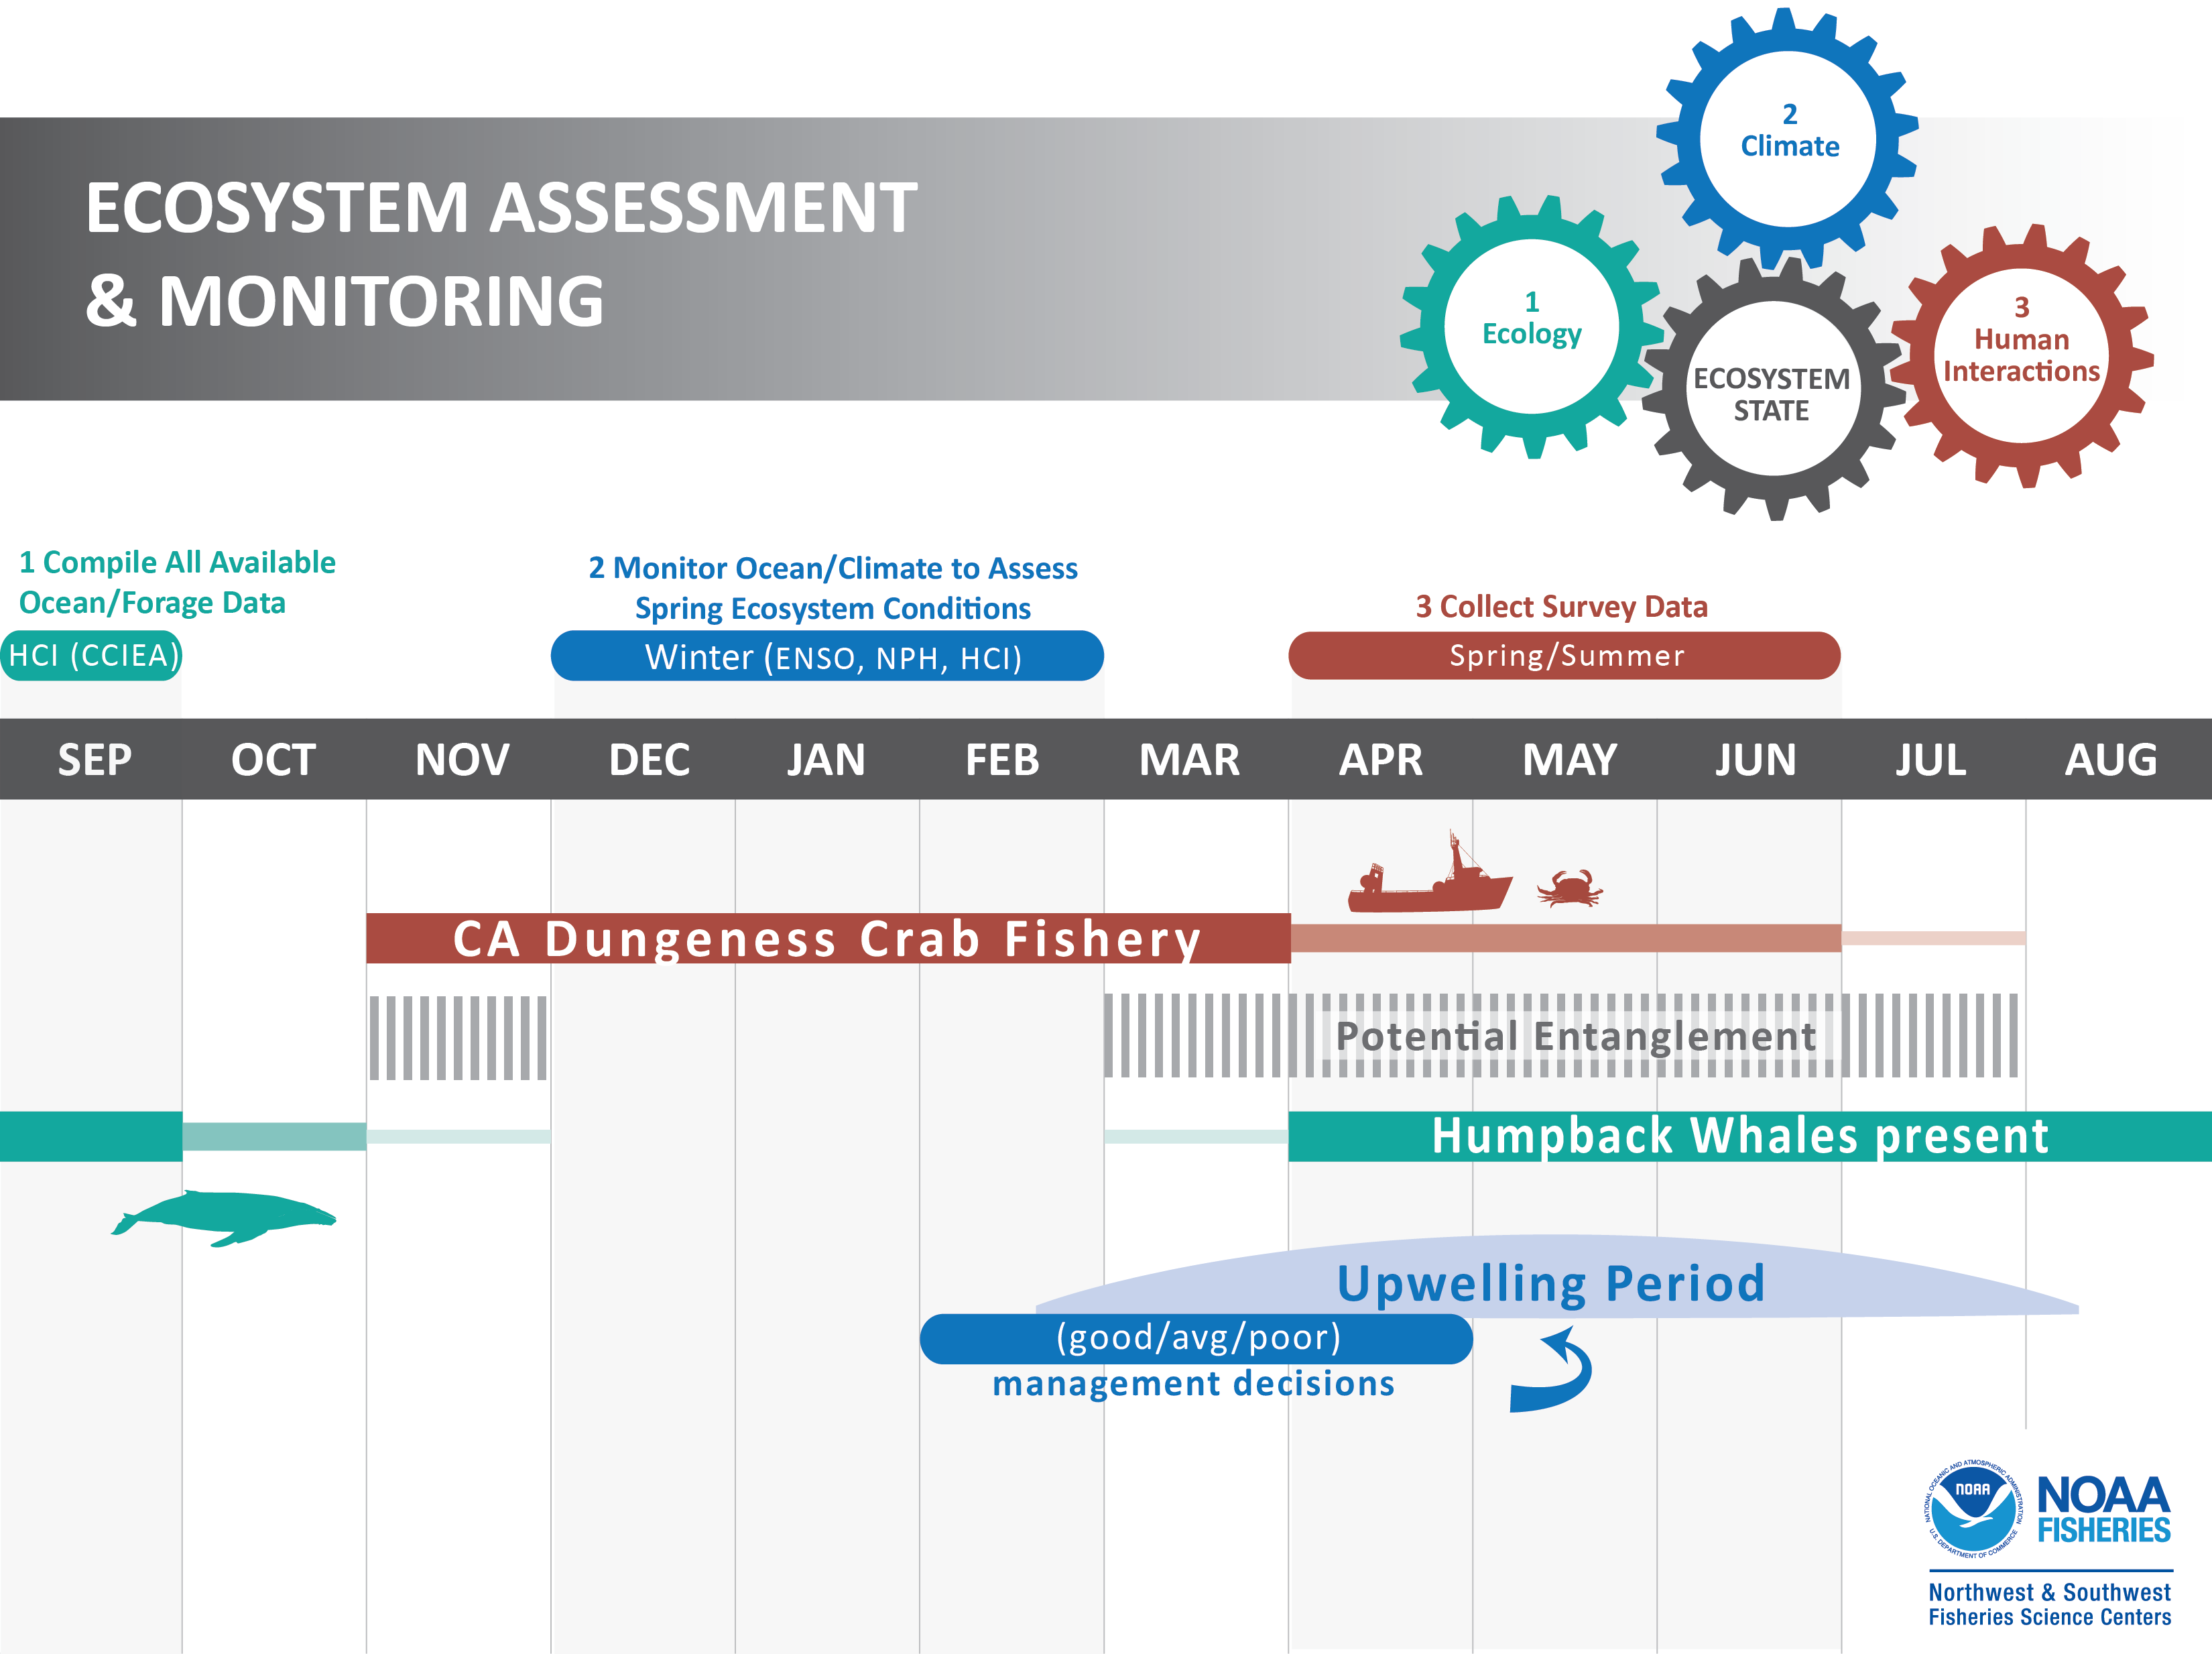
In part, the increase was spurred by a unique combination of variables: environmental conditions, distribution of fishing effort, distributions of important whale prey, and public awareness (Figure 2). In response, multiple government agencies, fishermen, and environmental organizations are actively engaged and committed to finding solutions that reduce the number of entanglements while continuing to support economically valuable fisheries.

whale entanglement conceptual model
Figure 1: Factors contributing to whale entanglements in fishing gear, 2014-2016. (Click on image for larger version)


Annual timeline of conditions contributing to whale entanglements
Figure 2: Graphic depicting how seasonal patterns of climate / ocean conditions, ecological processes, and human activities interact to enhance risk of whale entanglement in the central California Current (Click for larger version)


A goal of Integrated Ecosystem Assessment (IEA) scientists is to provide science support for Ecosystem Based Management. On this page, we compile timely, relevant, spatially explicit information that can help managers, industry, and other stakeholders better understand and mitigate the causes of large whale entanglements in marine waters of the California Current.

What are the whale entanglement patterns?

West Coast

Whale entanglement data is compiled by NOAA Fisheries West Coast Region. Use this Interactive Map to view the spatial distribution of entanglement records by species, gear type, and year.

What are the contributing factors / potential indicators of whale entanglement risk? 

Research by NOAA scientists and partners has shed light on conditions that may cause increases in whale entanglements: 

Indicator Table

The Table below enables you to access a full suite of individual whale entanglement indicators, with detailed descriptions, standardized (as well as customizable) plots, and downloadable data.

A spatial time series that tracks the area of coastal upwelling habitat, the Habitat Compression Index (HCI) is a regional indicator used to assess the likelihood of ecosystem shifts and shoreward distribution patterns of top marine predators like whales. Smaller values indicate periods when cool habitat is compressed onshore, heightening whale entanglement risk. Monthly HCI values are provided for the following latitude ranges:

A combination of basin and regional scale indicators used to inform the seasonal development and variability of coastal upwelling, particularly in the spring. For example, the winter North Pacific High (NPH) monitors the area and intensity of atmospheric pressure, indicating whether strong upwelling conditions and krill populations are likely in the spring.

NOAA Fisheries prepares stock assessment reports for all marine mammals in U.S. waters; population size estimates are derived from shipboard surveys and mark-recapture methods.


Prey indices provide information on the abundance of krill and forage fish, key forage species for whales, and provide context for whether predators may concentrate in particular feeding grounds where these species are likely present. Increased coastal abundance of forage species can heighten whale entanglement risk.

Central California

On the U.S. West Coast, whales have been documented entangled with gear and debris associated with numerous fishery and non-fishery sources (Saez et al. 2020). The most common source of entanglements is Dungeness crab gear, but other documented sources include pot/trap gear targeting CA spot prawn, sablefish, spiny lobster, coonstripe shrimp, and rock crab, as well as gillnets targeting highly migratory species, salmon, and other fishes.

Dungeness Crab Landings

Dungeness crab fishing activity maps created by the NWFSC. Use this interactive map to view the spatial distribution of Dungeness crab fishing activity off the US West Coast, binned in 4-month intervals from 2010 - 2016 (Feist et al. 2021).

Whale entanglement data is compiled by NOAA Fisheries West Coast Region. An Interactive Map (above) can also be used to view the spatial distribution of entanglement records by species, gear type, and year.

Data Dashboard

The Data Dashboard has a suite of stacked, interactive plots that describe environmental conditions, whale and prey populations, and fishing activity along the West Coast in recent decades.

data dashboard


How can management strategy evaluation tools help us clarify tradeoffs in revenue loss from whale entanglement mitigation and fishery closures?

dashboard

We examined how the record 2014–2016 Northeast Pacific marine heatwave influenced trade-offs in managing conflict between conservation goals and human activities using a case study on large whale entanglements in the U.S. west coast's most lucrative fishery (the Dungeness crab fishery) (Samhouri et al. 2021, Welch et al. 2023). 

Click on the map icon to the left to use a decision support tool that explores risk and revenue trade-offs regarding whale entanglements in the Dungeness crab fishery.

This dynamic app allows for retrospective analysis on how enacting Risk Assessment and Mitigation Program (RAMP) zone closures affects trade-offs between avoiding whale risk and protecting fisheries revenue.

More specifically, it contains spatial information on the distributions of Dungeness crab fishery revenue, humpback, and blue whales from November 2009 to April 2019, relative to the seven RAMP zones.