What is a marine heatwave?
Marine heatwaves, or MHWs, occur when ocean temperatures are much warmer than usual for an extended period of time; they are specifically defined by the difference between the current temperature and the expected temperature for a specific location and time of year [1]. MHWs are a growing field of study worldwide because of their effects on ecosystem structure, biodiversity, and regional economies.
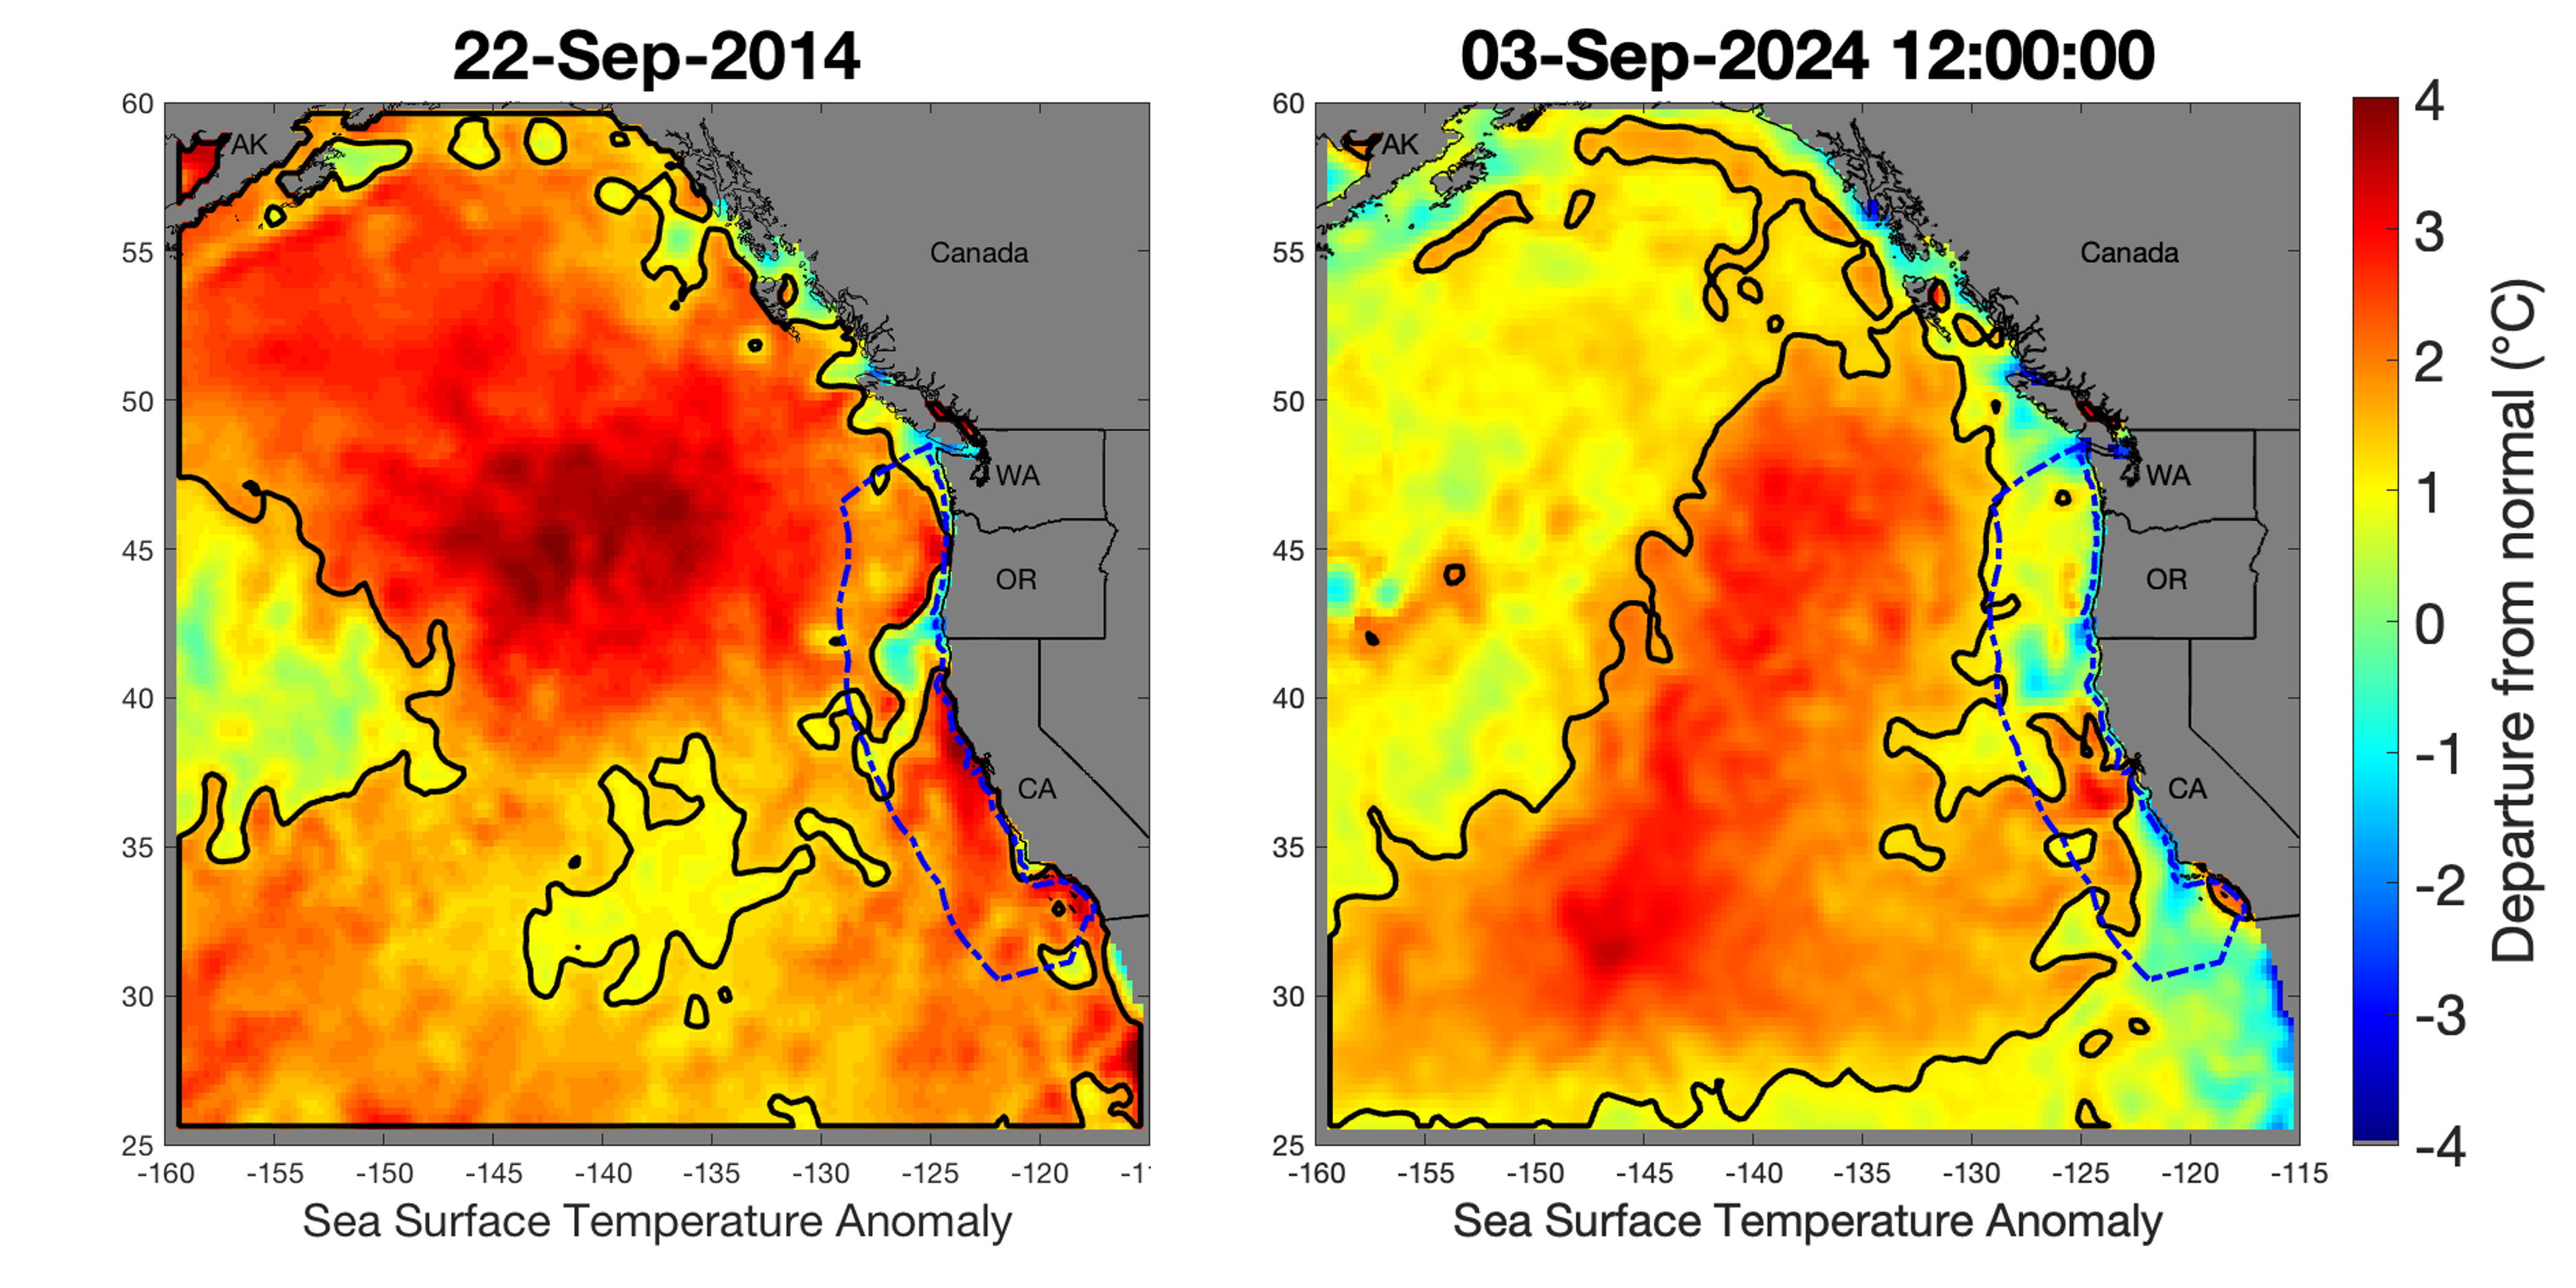
In 2014 a large MHW was identified as it began dominating the northeast Pacific Ocean. Eventually known as “The Blob” [2] (Fig. 3A.), this basin-scale MHW was unique in the history of monitoring in the California Current, and persisted until mid-2016. Researchers documented many ecological effects associated with “The Blob”, including unprecedented harmful algal blooms, shifting distributions of marine life, and changes in the marine food web [3].
Large marine heatwaves have occurred each of the last six years (2019 - 2024), all typically beginning during the spring in the far offshore region of the open North Pacific, impacting the US west coast during the fall, and finally terminating during late winter. Of the last six years, five of these were the largest heatwaves on record for the eastern North Pacific since monitoring began in 1982 (calculated only within the analyzed region shown in Fig. 2). However, note some of these heatwaves were likely larger as they extended beyond the borders of this prescribed region at various times. Animations of recent years' heatwaves can be found here..
To further investigate past MHW events, access this table of detailed information (i.e., size, duration, distance from shore) or an archive of past yearly animations.
What are the latest conditions?
(last updated 25 June, 2025)
We are currently tracking NEP25A, a moderately sized marine heatwave which arose in early May 2025 and is currently located in the central portion of the analyzed region (Fig. 1). In general, we have seen anomalously warm surface waters in this central region since early April, however, the distribution has been very patchy in both time and space, making the tracking of individual features difficult. Several ephemeral MHWs have arisen in various locations throughout the central and southwest portion of the analyzed region over the past two months, but these often last only 1-3 days as coherent features above our temperature (>90% of all measurements for a location at that time of year) and area (>400k km2) thresholds. This marine heatwave development pattern still roughly matches what we have typically seen over the past several years: warming during late spring within the GOA and central region, followed by feature enlargement, and then shoreward encroachment. Of note during the week of May 10, 2025, NEP25A briefly did reach within approximately 50-75 km of the OR and WA coast, which is much closer (than typical for this time of year, but it has now receded further offshore.
NEP25A follows closely on the heels of NEP24A, which has finally receded below our tracking criteria as of May 3rd, 2025, and was located to the southwest of the analyzed region. NEP24A began last year on approximately April 28 2024, reached its maximum size of ~5.5 million km2 on Oct 17, 2024, decreased in size during the fall without falling beneath any of the defining MHW thresholds, then continued to decrease in size as it receded offshore during the winter of 2024/2025. NEP24A currently ranks as the 6th largest by area and 3rd longest by duration since satellite monitoring began in 1982. Compared to other recent marine heatwaves, NEP24A is slightly unusual in that it lingered into the spring season in the southern part of the examined region, rather than the Gulf of Alaska. Coastal sea surface temperatures within the EEZ (exclusive economic zone, denoted by blue dashed line on figures) remain close to the long term average, or below average in local regions.
The current heatwave forecast (https://psl.noaa.gov/marine-heatwaves/) suggests heatwaves may continue through the next several months in the far offshore regions where they currently reside, with higher likelihood to the north and within the Gulf of Alaska. The El Niño forecast suggests that we will continue in an ENSO neutral state through summer 2025, with a slight increase towards La Niña probability as we head towards fall (see https://www.cpc.ncep.noaa.gov/products/analysis_monitoring/enso_advisory/ensodisc.shtml). We will continue to monitor the area, duration, and coastal proximity of surface water temperatures for these features in the northeast Pacific and communicate with other researchers and policy-makers to understand the array of possible West Coast impacts.
Animations and images of past years' developing heatwaves can be found here: NEP24A animation, NEP23A animation; previous archived animations.
View new and ongoing analyses highlighting regional conditions associated with individual west coast National Marine Sanctuaries and States (Washington, Oregon, and northern, central, and southern California).
What is the MHW Tracker (aka "Blobtracker")?
Developed by oceanographers from NOAA Fisheries’ Southwest Fisheries Science Center as an experimental tool for natural resource managers, the California Current MHW Tracker (aka “Blobtracker”) is a program designed to describe and thereby provide historical context for current and past large marine heatwaves. It also produces a range of indices that could help forecast or predict future MHWs expected to impact our coast.
Because “The Blob” dramatically affected natural resources, including economically valuable fisheries, predictive forecasts will help natural resource managers, businesses, and coastal communities anticipate changes and mitigate possible damages in the future.
The California Current MHW Tracker automatically analyzes sea surface temperature anomalies (SSTa) from 1982- present, with a particular focus on detecting the presence of significant ”Blob-Class” events. Sea surface temperature (SST) data were obtained from a variety of different platforms (satellites, ships, buoys) on a regular global grid at a resolution of 1/4°, as provided by NOAA’s OISST program.
Here, we define “Blob-Class” MHWs based on their strength (>1.29 times the standard deviation of the SSTa field; e.g., the top 90% of the data), along with their areal extent (area > 400,000 km², which includes the top 20% of all heatwaves recorded in this region since 1982). The “Blobtracker” program groups all contiguous pixels satisfying the strength threshold, and then tracks those contiguous regions over time, as long as they continue to satisfy the area threshold and spatially overlap at least part of a similar feature from the day before. This allows the tracking and classification of these large marine heatwaves as they evolve and move around the north Pacific, similar to how one would track large storms or hurricanes. We have adopted a naming convention for these tracked heatwaves of giving them a number based on the year of their first crossing the area threshold, and a letter corresponding to the order in which they arise each year (e.g. the second “Blob-Class” heatwave that arises in 2010, would be called NEP10b, with the NEP standing for Northeast Pacific). Besides tracking these large “Blob-Class” features, we also provide indices related to how much of the EEZ (Exclusive economic zone) of the US west coast is in heatwave status, by calculating the % total area within the EEZ exceeding the strength threshold, regardless of the area-tracking threshold (Fig. 4).
What controls the presence of heatwaves near the coastline?
For fisheries management purposes, the most important aspect of these heatwaves are whether they come into close contact with our coasts and within the EEZ, as these are the regions where the majority of our fisheries resources are based. Although local forces are important, the dominant feature which controls coastal water temperatures in the California Current system (CCS) is alongshore wind patterns. Because of the orientation of the US west coast coastline (predominantly N-S) and the general flow of the CCS (from north to south along the coast), and the effects of coriolis, our coast is heavily impacted by a process known as upwelling. Essentially, when wind blows from north towards the south along this coast, it causes an “upwelling” of deeper, colder, nutrient rich waters to rise to the surface, displacing warmer surface waters offshore. Vice versa, when winds are weak, or blow from south to north, this may shut off (termed upwelling “relaxation”), or even reverse upwelling (termed “downwelling”), which allows surface waters to warm, and/or offshore waters to advect towards the coast.
Therefore, our working hypothesis is that much of the timing and occurrence of large marine heatwaves within the US west coast EEZ is related to changes in the winds driving upwelling. When upwelling winds weaken or reverse, coastal waters tend to warm. Further, when there are already large marine heatwaves in the offshore region, changes in wind direction and strength can lead to those features advecting into, or becoming contiguous with, warmed coastal waters during these upwelling “relaxation” or “downwelling” events if those events last for a significant period of time. Because of the presumed importance of these basin-scale winds driving upwelling patterns, which are in turn driven by basin-scale atmospheric pressure patterns (further described here), we have begun to closely monitor the wind and pressure patterns across this region, along with SSTa (Fig. 1).
Did marine heatwaves break any records last year?
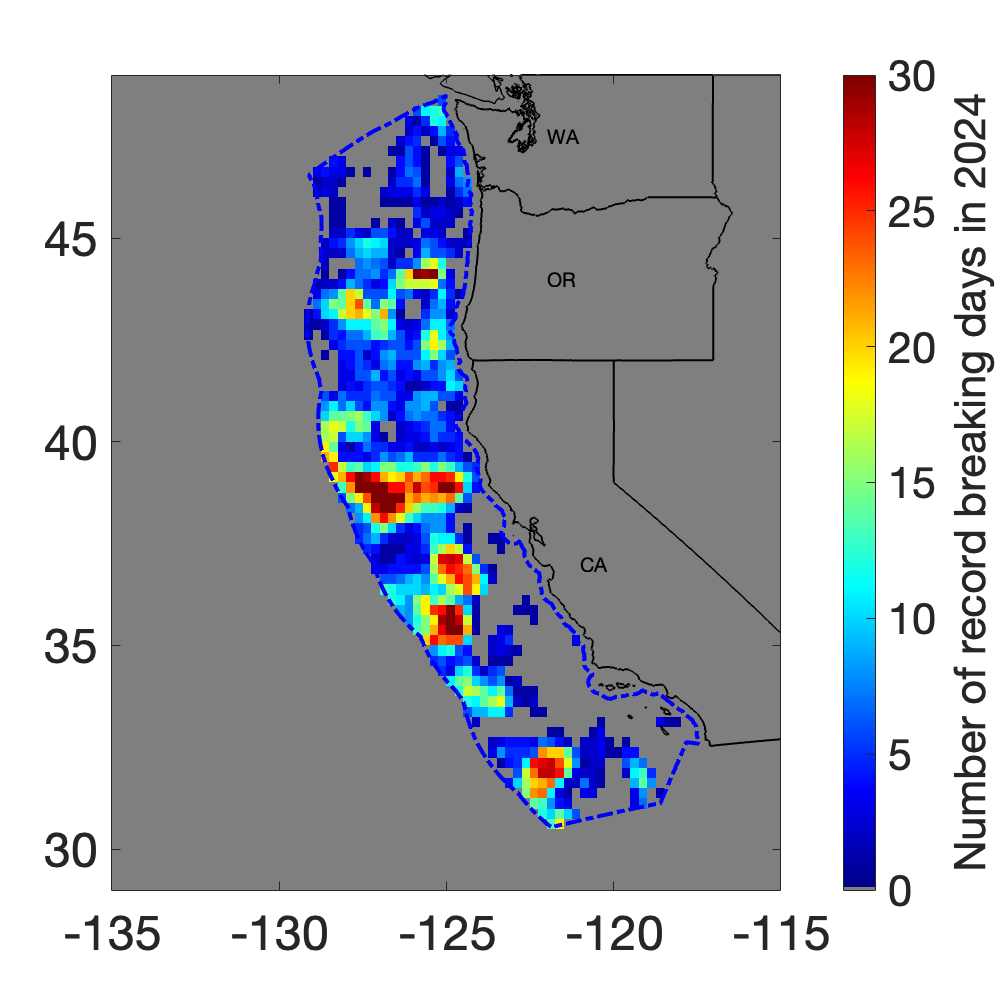
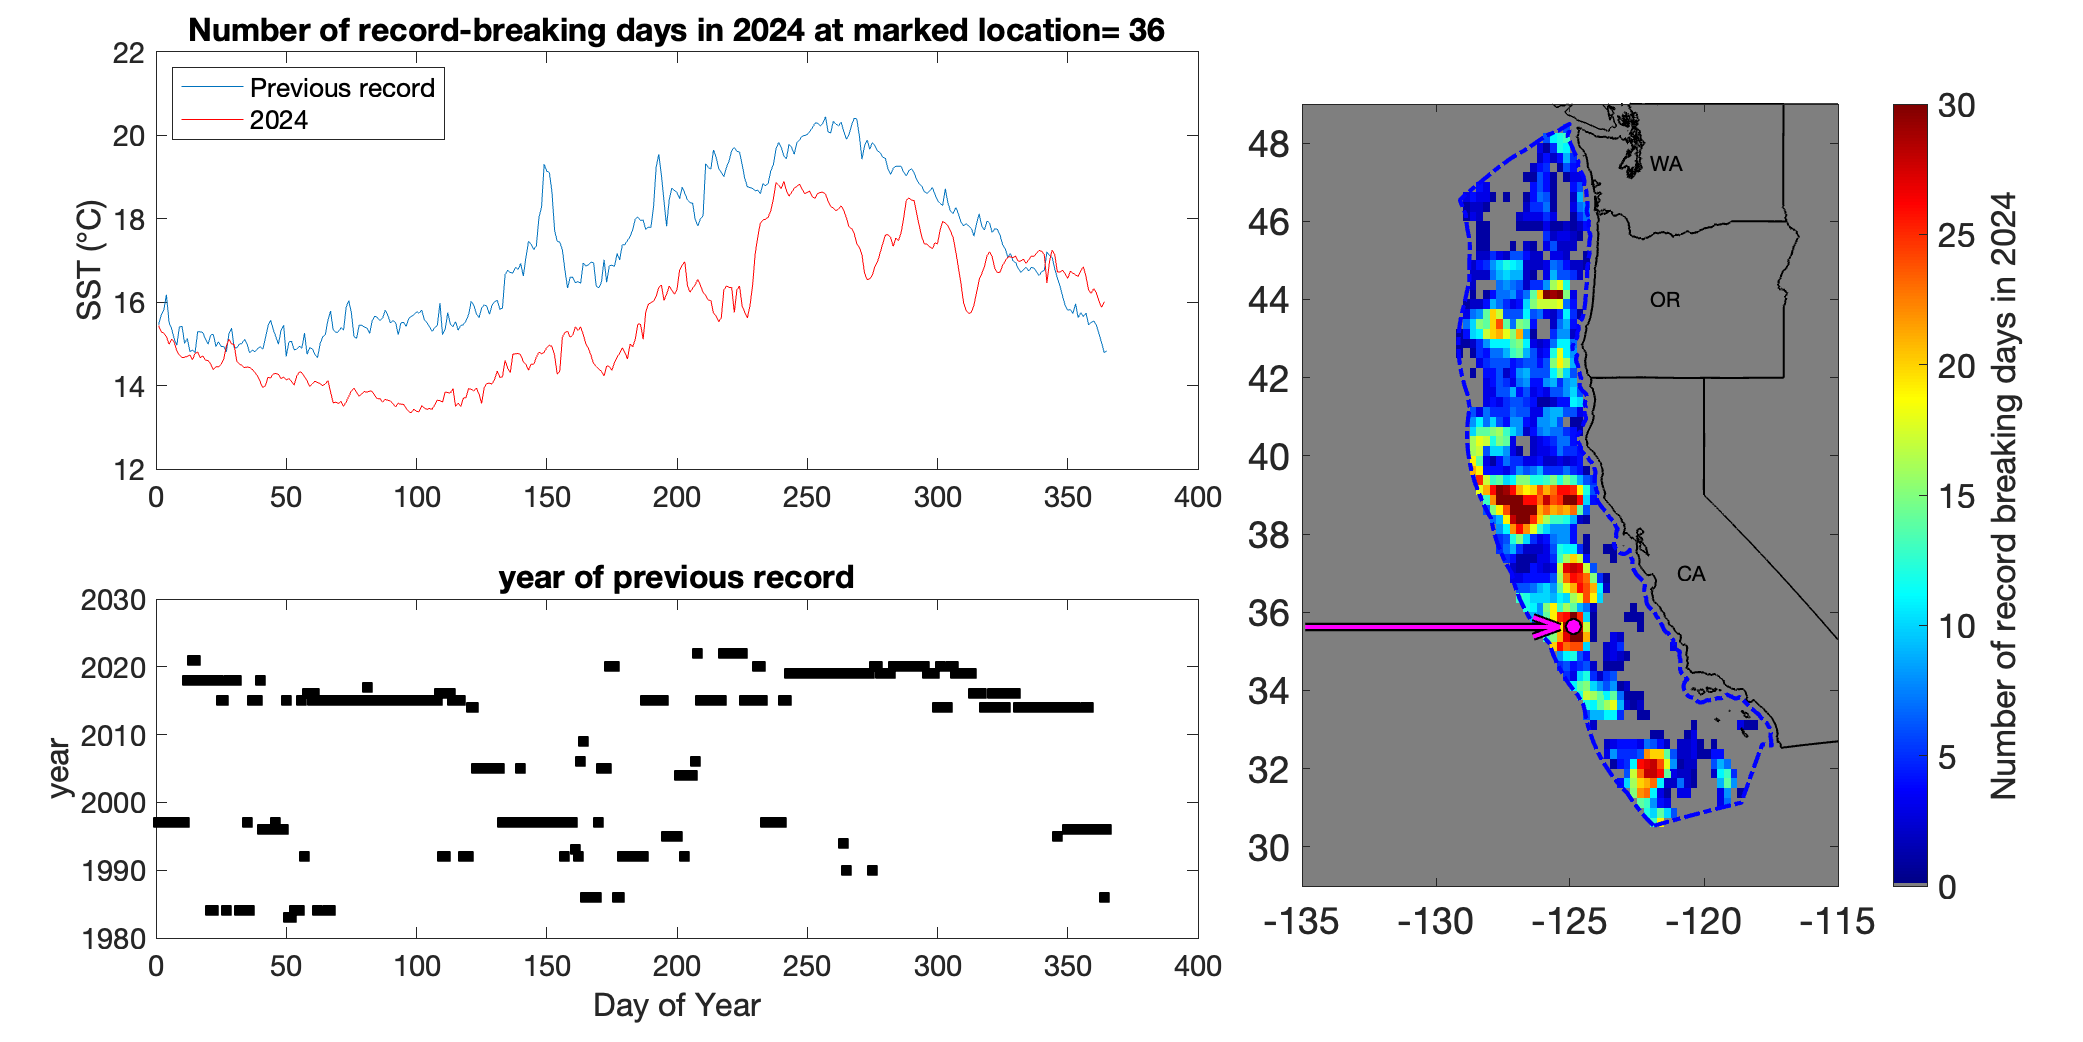
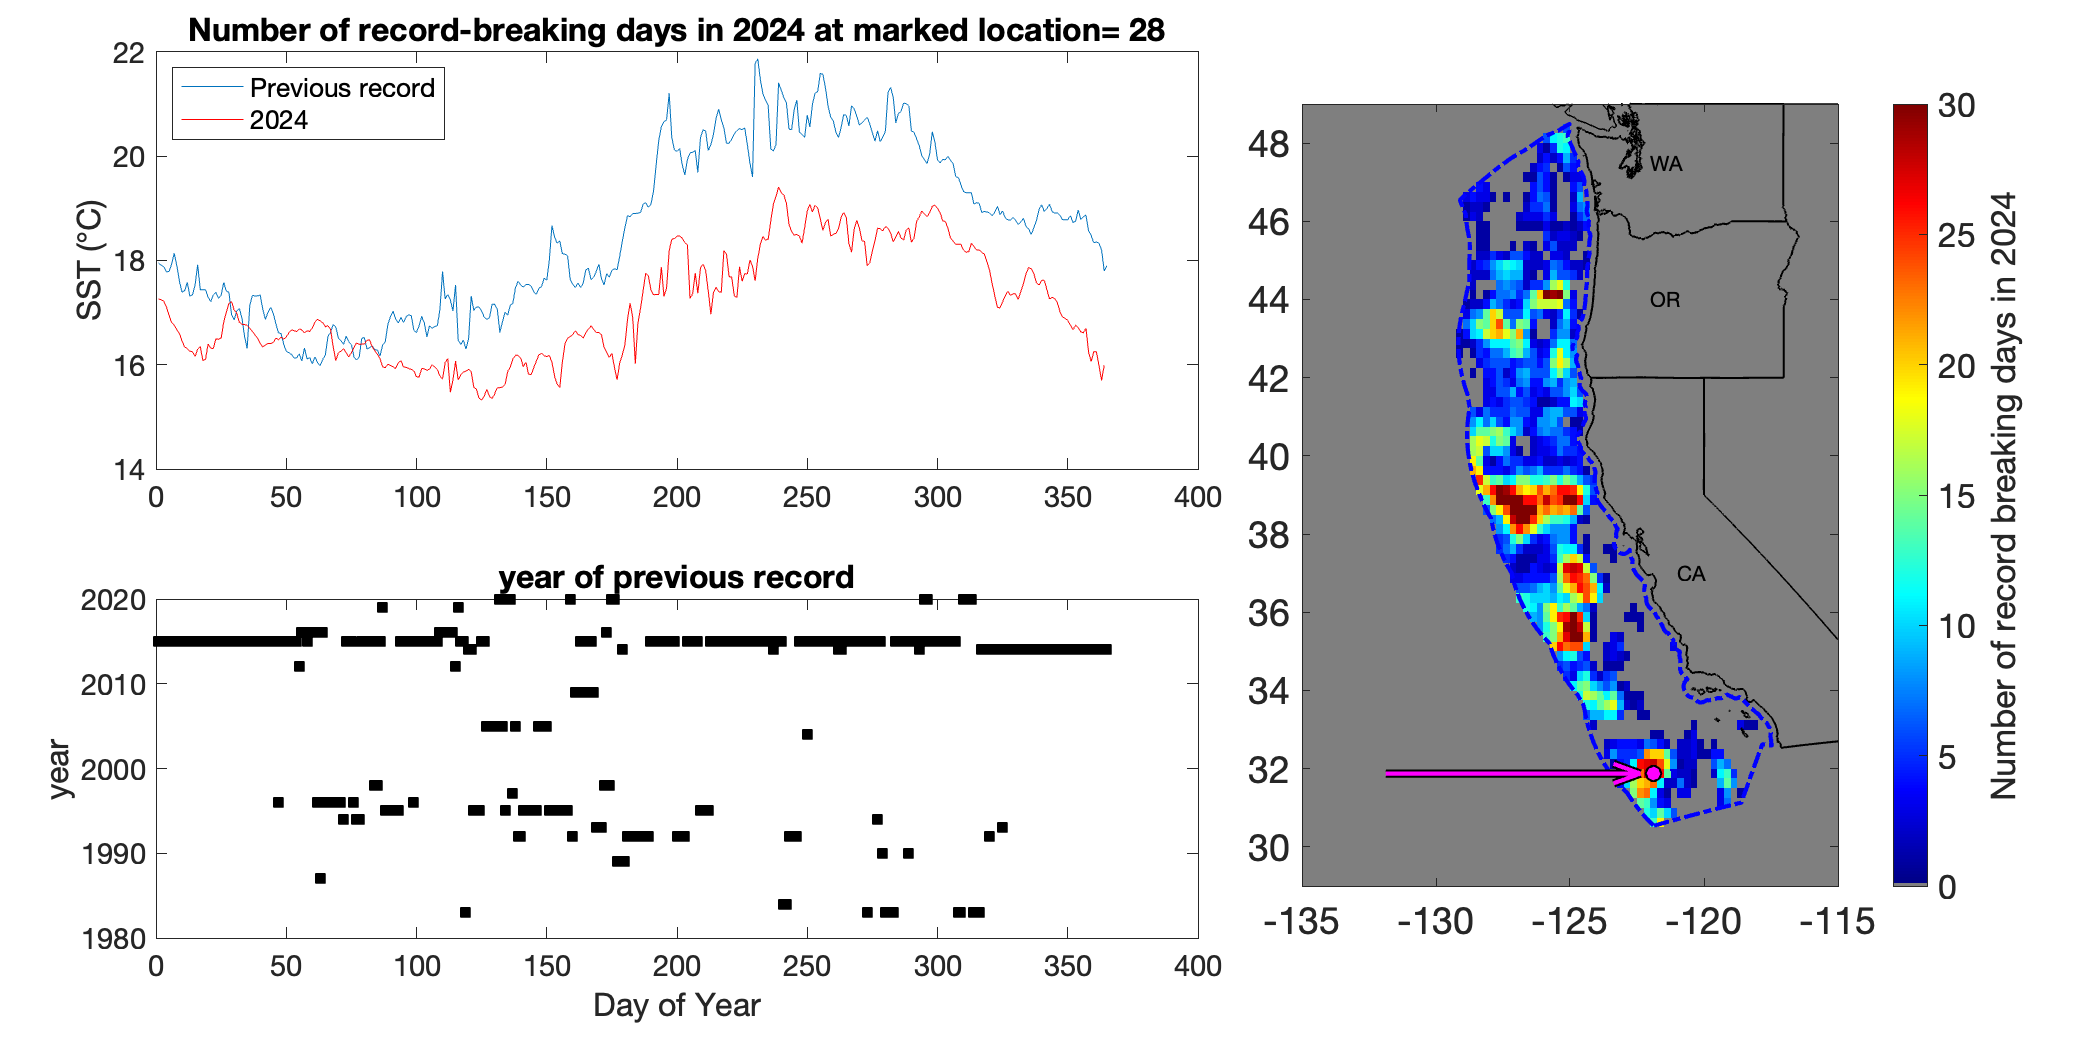
2024 saw some record breaking sea surface temperatures, but not nearly to the extent as during 2023. Within the California Current Exclusive Economic Zone (EEZ), we analyzed sea surface temperatures using satellite-based data extending back to 1982 to look for times and locations when new records were set during 2024. We define a “record breaker” as any location where the temperature on a specific day is higher than the previously recorded temperature at that location for that specific day of the year. We found a significant number of times and locations when daily sea surface temperature records were broken during 2024 (Fig. 6), the majority of which occurred in the farther offshore regions and central to southern regions (>100km from the coast) within the EEZ, rather than the nearshore zone. In the central region, most of these record-breaking temperatures occurred during the late winter during El Niño, and then again in the summer coincident with the intrusion of a large marine heatwave (Fig. 7). Within the south-central region comprising offshore regions of central CA, new temperature records also coincided with the El Niño and then also again during the late fall (Fig. 8). To the south, most records were broken during the late winter/early spring coincident with the El Niño (Fig. 9). Note that in most cases, previous temperature records were set either during the 1997/1998 El Niño or the unprecedented 2014/2015 marine heatwave, known as “The Blob”.
Project leads
Andrew Leising and Lynn DeWitt (SWFSC), Greg Williams (NWFSC)
References
[1] Hobday, A. J. et al. (2016), A hierarchical approach to defining marine heatwaves, Prog. Ocean., 141, pp. 227-238, 10.1016/j.pocean.2015.12.014
[2] Bond, N. A., Cronin, M. F., Freeland, H., & Mantua, N. (2015). Causes and impacts of the 2014 warm anomaly in the NE Pacific. Geophysical Research Letters, 42, 3414–3420. https://doi.org/10.1002/ 2015GL063306
[3] Cavole LM, Demko AM, Diner RE, Giddings A, Koester I, et al. (2016). Biological impacts of the 2013–2015 warm-water anomaly in the northeast Pacific: winners, losers, and the future. Oceanography 29(2):273–85