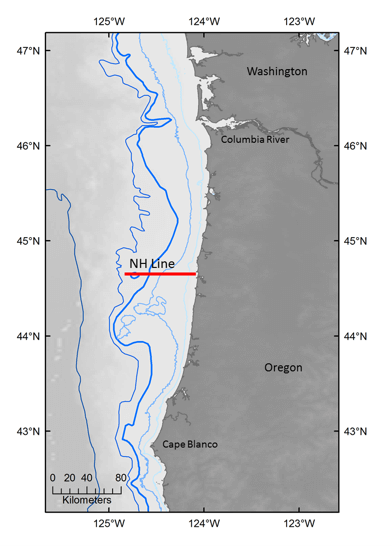
The Newport Hydrographic (Newport Line) is an oceanographic research survey conducted by NOAA's Northwest Fisheries Science Center and Oregon State University scientists in the coastal waters off Newport, Oregon (Fig. 1).
Researchers have collected physical, chemical, and biological oceanographic metrics along the Newport Line every two weeks for over 20 years. This twenty-plus year dataset helps us to understand the connections between changes in ocean-climate and ecosystem structure and function in the California Current.
Data from the Newport Line are distilled into ocean ecosystem indicators, used to characterize the habitat and survival of juvenile salmonids, and which have also shown promise for other stocks such as sablefish, rockfish, and sardine. These data also provide critical ecosystem information on emerging issues such as marine heatwaves, ocean acidification, hypoxia, and harmful algal blooms. The data dashboard can also be accessed directly to explore interactive plots or download data.
The California Current IEA team uses Newport Line data in our annual Ecosystem Status Report presented to the Pacific Fisheries Management Council (PFMC). This report is part of NOAA's Integrated Ecosystem Assessment approach, which uses ecosystem science to inform management decisions.
Ocean conditions provide outlooks for adult salmon returns
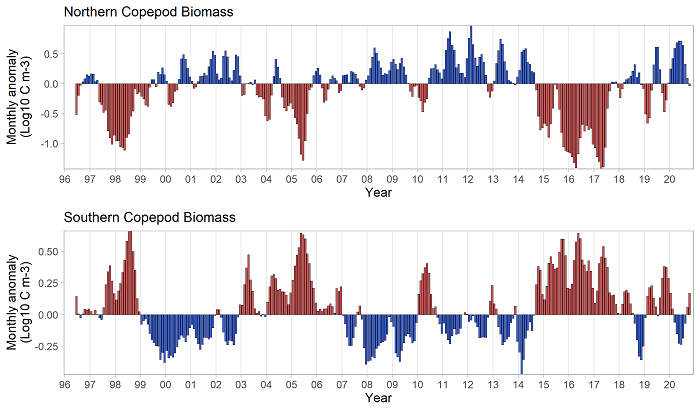
Salmon survival is closely correlated with ocean conditions experienced by young salmon entering the sea. NOAA and Oregon State researchers have distilled Newport Line data into a series of ecosystem indicators, such as the relative biomass of energy-rich northern copepod species (Fig. 2), to characterize ocean conditions for juvenile salmon entering the northern California Current.
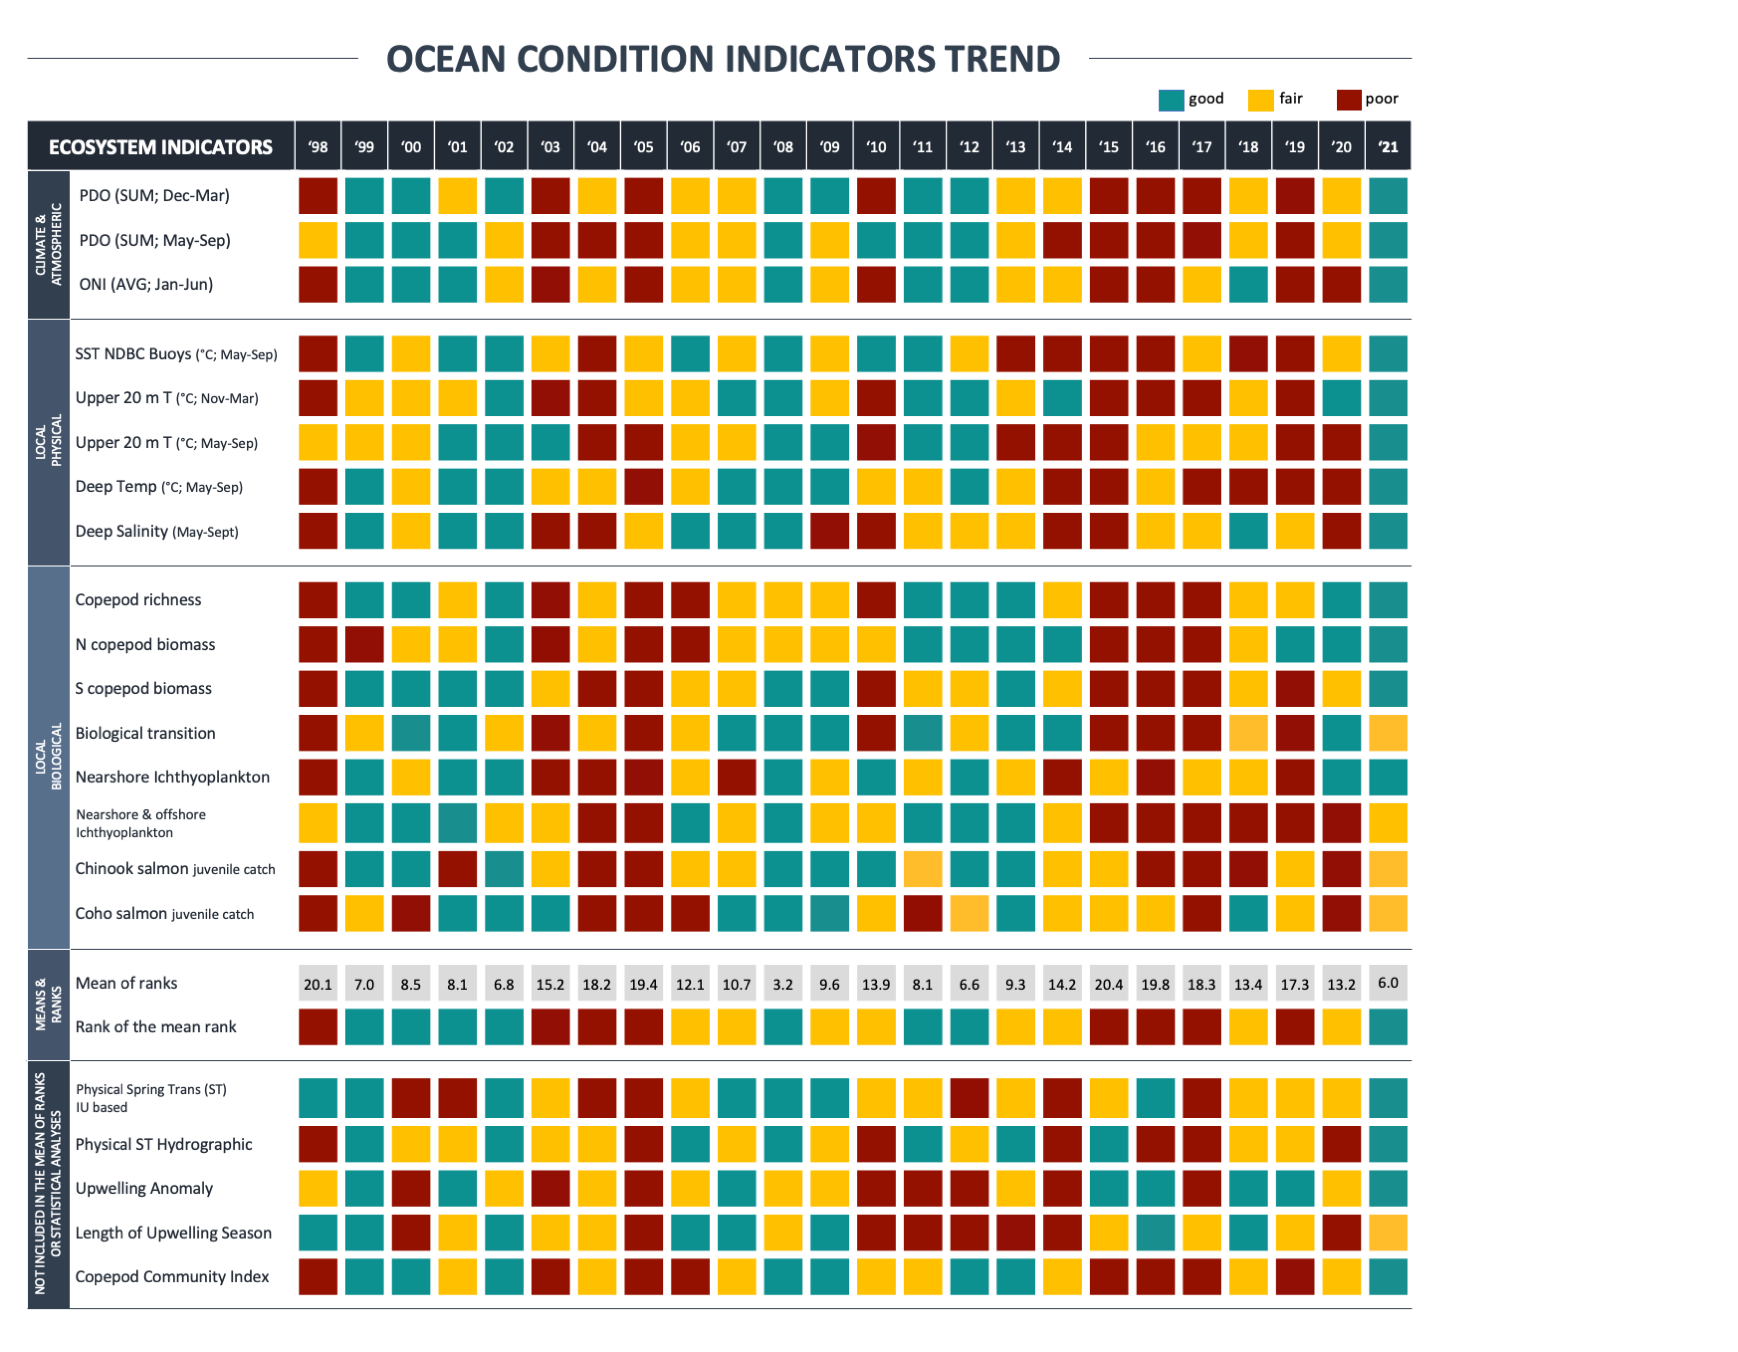
The researchers incorporate these indicators and other ocean metrics (basin, regional, and local) into a ‘stop light’ table (Fig. 3) that supports annual outlooks on salmon returns 1–2 years before they return to their natal streams.
Barometer of ocean acidification and hypoxia in a changing climate
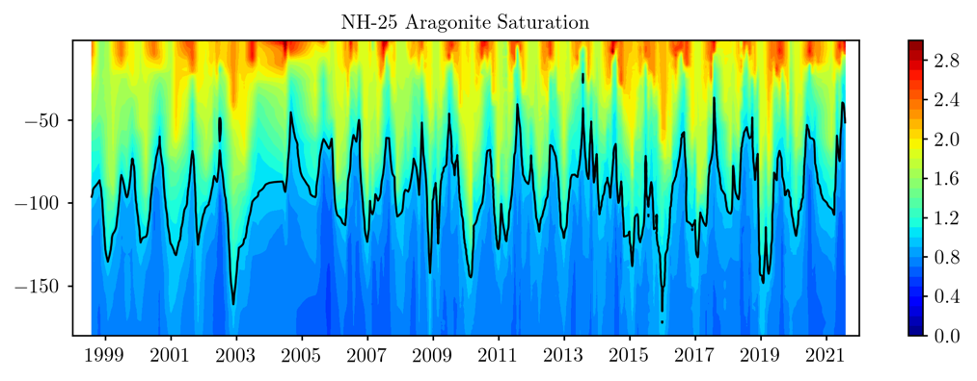
Global climate models suggest future changes in coastal upwelling will lead to increased incidence of hypoxia and further exacerbate the effects of ocean acidification. The Newport Line time-series provides a baseline of biogeochemical parameters, such as Aragonite saturation state—an indicator of acidic conditions (Fig. 4). Researchers can compare this baseline against possible future changes in the abundance of organisms (e.g., pteropods, copepods and krill) sensitive to ocean acidification and hypoxia.
Read more:
- Newportal Blog - Overview with data plots and contour maps
- NWFSC Ocean Ecosystem Indicators website
- Newport Hydrographic Line data dashboard
- CCIEA Data Portal
Newport Hydrographic Line team:
- Jennifer Fisher- NOAA-NWFSC
- Samantha Zeman- OSU-CIMERS
- Anna Bolm- OSU-CIMERS
- Joshua Bowman- OSU-CIMERS
- NOAA Fisheries - Northwest Fisheries Science Center
- CIMERS - Cooperative Institute for Marine Ecosystem and Resources Studies
- OSU - Oregon State University
References:
- Keister, J.E., E. Di Lorenzo, C.A. Morgan, V. Combes, W.T. Peterson. 2011. Zooplankton species composition is linked to ocean transport in the northern California Current. Global Change Biology 17: 2498-2511. https://doi.org/10.1111/j.1365-2486.2010.02383.x
- Fisher, J.L., W.T. Peterson, R.R. Rykaczewski. 2015. The impact of El Niño events on the pelagic food chain in the northern California Current. Global Change Biology, 21: 4401-4414.
- Peterson, W.T., J.L. Fisher, P.T. Strub, X. Du, C. Risien, J. Peterson, C.T. Shaw. 2017. The pelagic ecosystem in the Northern California Current off Oregon during the 2014-2016 warm anomalies within the context of the past 20 years. Journal of Geophysical Research: Oceans 122: 7267-7290. https://doi.org/10.1002/2017JC012952
- Peterson, W.T., J.L. Fisher, J.O. Peterson, C.A. Morgan, B.J. Burke, K.L. Fresh. 2014. Applied fisheries oceanography: ecosystem indicators of ocean conditions inform fisheries management in the California Current. Oceanography, 27: 80-89.
- Harvey, C.J., J.L. Fisher, J.F. Samhouri, G.D. Williams, T.B. Francis, K.C. Jacobson, L. Yvonne, M.E. Hunsicker, N. Garfield. 2020. The importance of long-term ecological time series for integrated ecosystem assessment and ecosystem-based management. Progress in Oceanography 58: 2279-2292.
- Peterson, J.O., C.A. Morgan, W.T. Peterson, E. Di Lorenzo. 2013. Seasonal and interannual variation in the extent of hypoxia in the northern California Current from 1998-2012. Limnology and Oceanography 58: 2279-2292.
- Du, X., W. Peterson, J. Fisher, M. Hunter, J. Peterson. 2016. Initiation and development of a toxic and persistent Pseudo-nitzchia bloom off the Oregon coast in spring/summer 2015. PLOS ONE 11, e0163977. https://doi.org/10.1371/journal.pone.0163977