What is a marine heatwave?
Marine heatwaves, or MHWs, occur when ocean temperatures are much warmer than usual for an extended period of time; they are specifically defined by the difference between the current temperature and the expected temperature for a specific location and time of year [1]. MHWs are a growing field of study worldwide because of their effects on ecosystem structure, biodiversity, and regional economies.
In 2014 a large MHW was identified as it began dominating the northeast Pacific Ocean. Eventually known as “The Blob” [2] (Fig. 3A.), this basin-scale MHW was unique in the history of monitoring in the California Current, and persisted until mid-2016. Researchers documented many ecological effects associated with “The Blob”, including unprecedented harmful algal blooms, shifting distributions of marine life, and changes in the marine food web [3].
Large marine heatwaves have occurred each of the last five years (2019 - 2023), all typically beginning during the spring in the far offshore region of the open North Pacific, impacting the US west coast during the fall, and finally terminating during late winter. Of the last five years, four of these were the largest heatwaves on record for the eastern North Pacific since monitoring began in 1982 (calculated only within the analyzed region shown in Fig. 2). However, note some of these heatwaves were likely larger as they extended beyond the borders of this prescribed region at various times. Animations of recent years' heatwaves can be found here..
To further investigate past MHW events, access this table of detailed information (i.e., size, duration, distance from shore) or an archive of past yearly animations.
What are the latest conditions?
(last updated 24 April 2024)
Although the Pacific is still technically experiencing an El Niño, conditions along the equator show that the strength of the El Niño has decreased (see April 2024 ENSO update: gone fishing | NOAA Climate.gov). Along the US west coast, sea surface temperature anomalies have steadily decreased and are approaching climatological averages over the last month (Fig. 1, 2, and 4), reflecting the weakening influence of El Niño in this region. However, there are still considerable areas of anomalously warm temperatures in pockets along the coast. As in previous years, it is likely that anomalously warm areas in offshore regions to the northwest may develop into a larger heatwave that continues through the summer and into fall, with possible coastal impacts.
The current heatwave forecast (https://psl.noaa.gov/marine-heatwaves/) suggests that the warming along the coast will most likely subside, consistent with the weakening of the El Niño, although the far offshore northwest area will likely remain warmer than normal through the summer. The current El Niño forecast suggests that we will enter an ENSO neutral state sometime from May - June, and then most likely transition to a La Niña state by the fall of 2024 (see https://www.cpc.ncep.noaa.gov/products/analysis_monitoring/enso_advisory/ensodisc.shtml). We will continue to monitor the area, duration, and coastal proximity of surface water temperatures for these features in the northeast Pacific and communicate with other researchers and policy-makers to understand the array of possible West Coast impacts.
Animations and images of past years' developing heatwaves can be found here: NEP2023A animation; NEP22A animation; previous archived animations.
View new and ongoing analyses highlighting regional conditions associated with individual west coast National Marine Sanctuaries and states (Washington, Oregon, and northern, central, and southern California).
What is the MHW Tracker (aka "Blobtracker")?
Developed by oceanographers from NOAA Fisheries’ Southwest Fisheries Science Center as an experimental tool for natural resource managers, the California Current MHW Tracker (aka “Blobtracker”) is a program designed to describe and thereby provide historical context for current and past large marine heatwaves. It also produces a range of indices that could help forecast or predict future MHWs expected to impact our coast.
Because “The Blob” dramatically affected natural resources, including economically valuable fisheries, predictive forecasts will help natural resource managers, businesses, and coastal communities anticipate changes and mitigate possible damages in the future.
The California Current MHW Tracker automatically analyzes sea surface temperature anomalies (SSTa) from 1982- present, with a particular focus on detecting the presence of significant ”Blob-Class” events. Sea surface temperature (SST) data were obtained from a variety of different platforms (satellites, ships, buoys) on a regular global grid at a resolution of 1/4°, as provided by NOAA’s OISST program.
Here, we define “Blob-Class” MHWs based on their strength (>1.29 times the standard deviation of the SSTa field; e.g., the top 90% of the data), along with their areal extent (area > 400,000 km², which includes the top 20% of all heatwaves recorded in this region since 1982). The “Blobtracker” program groups all contiguous pixels satisfying the strength threshold, and then tracks those contiguous regions over time, as long as they continue to satisfy the area threshold and spatially overlap at least part of a similar feature from the day before. This allows the tracking and classification of these large marine heatwaves as they evolve and move around the north Pacific, similar to how one would track large storms or hurricanes. We have adopted a naming convention for these tracked heatwaves of giving them a number based on the year of their first crossing the area threshold, and a letter corresponding to the order in which they arise each year (e.g. the second “Blob-Class” heatwave that arises in 2010, would be called NEP10b, with the NEP standing for Northeast Pacific). Besides tracking these large “Blob-Class” features, we also provide indices related to how much of the EEZ (Exclusive economic zone) of the US west coast is in heatwave status, by calculating the % total area within the EEZ exceeding the strength threshold, regardless of the area-tracking threshold (Fig. 4).
What controls the presence of heatwaves near the coastline?
For fisheries management purposes, the most important aspect of these heatwaves are whether they come into close contact with our coasts and within the EEZ, as these are the regions where the majority of our fisheries resources are based. Although local forces are important, the dominant feature which controls coastal water temperatures in the California Current system (CCS) is alongshore wind patterns. Because of the orientation of the US west coast coastline (predominantly N-S) and the general flow of the CCS (from north to south along the coast), and the effects of coriolis, our coast is heavily impacted by a process known as upwelling. Essentially, when wind blows from north towards the south along this coast, it causes an “upwelling” of deeper, colder, nutrient rich waters to rise to the surface, displacing warmer surface waters offshore. Vice versa, when winds are weak, or blow from south to north, this may shut off (termed upwelling “relaxation”), or even reverse upwelling (termed “downwelling”), which allows surface waters to warm, and/or offshore waters to advect towards the coast.
Therefore, our working hypothesis is that much of the timing and occurrence of large marine heatwaves within the US west coast EEZ is related to changes in the winds driving upwelling. When upwelling winds weaken or reverse, coastal waters tend to warm. Further, when there are already large marine heatwaves in the offshore region, changes in wind direction and strength can lead to those features advecting into, or becoming contiguous with, warmed coastal waters during these upwelling “relaxation” or “downwelling” events if those events last for a significant period of time. Because of the presumed importance of these basin-scale winds driving upwelling patterns, which are in turn driven by basin-scale atmospheric pressure patterns (further described here), we have begun to closely monitor the wind and pressure patterns across this region, along with SSTa (Fig. 1).
Did marine heatwaves break any records last year?
2023 saw some of the warmest temperatures on record, both on land and at sea. Within the California Current Exclusive Economic Zone (EEZ), we analyzed sea surface temperatures using satellite-based data extending back to 1982 to look for times and locations when new records were set during 2023. We define a “record breaker” as any location where the temperature on a specific day is higher than the previously recorded temperature at that location for that specific day of the year. We found a significant number of times and locations when daily sea surface temperature records were broken during 2023 (Fig. 6), an overwhelming majority of which occurred in the farther offshore regions (>100km from the coast) within the EEZ, rather than the nearshore zone. To the north, most of these record-breaking temperatures occurred during the summer coincident with the intrusion of the large marine heatwave, and included some days that set absolute all-time records for this location on any date since 1982 (Fig. 7). Within the central region comprising offshore regions of northern CA and OR, most temperature records also coincided with the summer heatwave, but some additional records were broken during the late fall/early winter as El Niño conditions arose (Fig. 8). To the south, most records were broken during the late fall/early winter, coincident with the onset of the current El Niño (Fig. 9). Note that in most cases, previous temperature records were set either during the 1997/1998 El Niño or the unprecedented 2014/2015 marine heatwave, known as “The Blob”.
Project leads
Andrew Leising and Lynn DeWitt (SWFSC), Greg Williams (NWFSC)
References
[1] Hobday, A. J. et al. (2016), A hierarchical approach to defining marine heatwaves, Prog. Ocean., 141, pp. 227-238, 10.1016/j.pocean.2015.12.014
[2] Bond, N. A., Cronin, M. F., Freeland, H., & Mantua, N. (2015). Causes and impacts of the 2014 warm anomaly in the NE Pacific. Geophysical Research Letters, 42, 3414–3420. https://doi.org/10.1002/ 2015GL063306
[3] Cavole LM, Demko AM, Diner RE, Giddings A, Koester I, et al. (2016). Biological impacts of the 2013–2015 warm-water anomaly in the northeast Pacific: winners, losers, and the future. Oceanography 29(2):273–85

Figure 1: Daily sea surface temperature anomalies (SSTa) in the California Current ecosystem. Color represents SSTa, with the thick black line encircling regions which are in "heatwave status"; arrows represent wind speed and direction; thin lines represent atmospheric pressure at sea level. An animation of daily images through 2022 can be viewed here. SST data from Multi-scale Ultra-high Resolution (MUR) SST Analysis Anomaly (https://coastwatch.pfeg.noaa.gov/erddap/griddap/jplMURSST41anom1day.html); sea level pressure and wind data from NCEP/NCAR Reanalysis (https://coastwatch.pfeg.noaa.gov/erddap/esrlNcepRe.html).

Figure 2: Science-quality (delayed 3-weeks), daily interpolated standardized sea surface temperature anomalies (SSTa) in the California Current ecosystem available for analysis of MHW presence. Dark outline shows the current extent of MHW conditions, as delineated by values of the normalized SST + 1.29 SD from normal. Blue dashed line represents the US West Coast EEZ. Data from NOAA's Optimum interpolation Sea Surface Temperature analysis (OISST; https://www.ncdc.noaa.gov/oisst), with the SST anomaly calculated using climatology from NOAA's AVHRR-only OISST dataset.
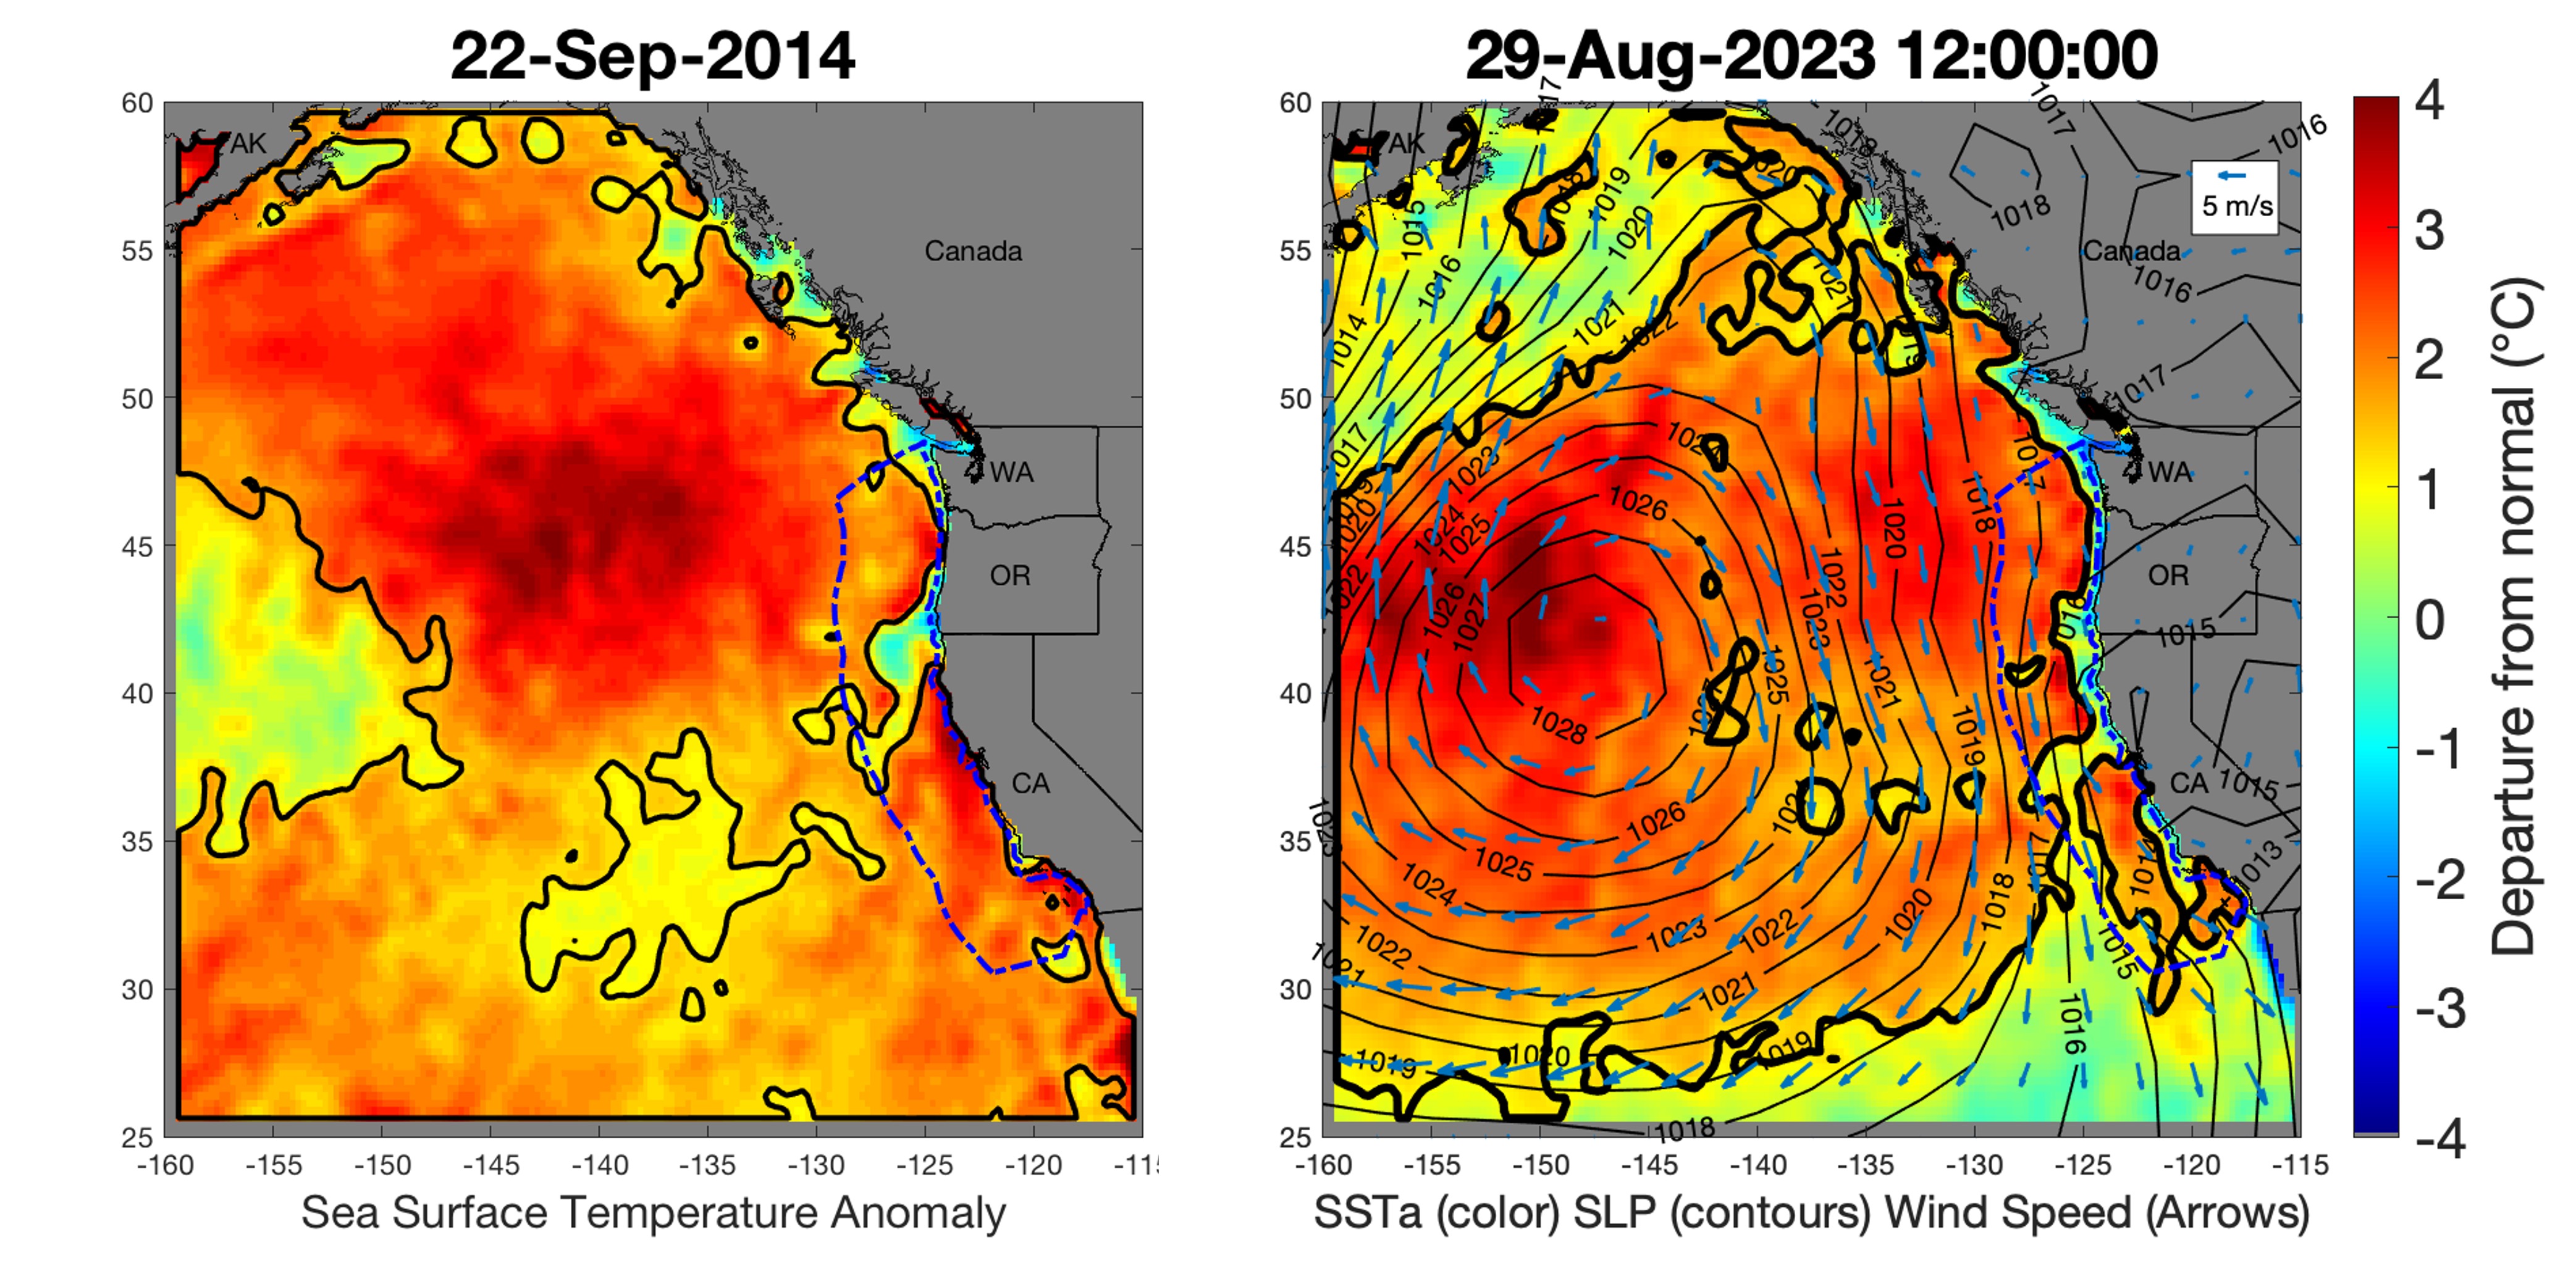
Figure 3A.(left): The MHW known as "the blob" at its near maximum areal extent in September 2014; 3B.(right) The 2023 MHW (NEP23A) at its near maximum areal extent in August 2023. Figure details as in Figure 2.


Figure 4 (top): Retrospective analysis of sea surface temperature anomalies in the California Current region, 1982-present. Figure shows daily total surface area from the entire study region (Fig. 2) in heatwave status over time. Thin horizontal line indicates the area threshold cutoff (approx. 400,000 km2) used for tracking and analysis of LMHs. Color indicates the % of the US west coast EEZ (area within blue dashed line, Fig. 2) in heatwave status. 4 (bottom): Daily estimated area of SST anomalies in the California Current region over the previous 12 months, color coded (as above) by relative EEZ coverage.

Figure 5: Top graph shows the total % of the US west coast EEZ (not including waters off of Alaska) that is classified as in "heatwave" status over the past year. Left lower panel shows the region covered by the EEZ (blue dashed line) and then subregions: WA (1), OR (2), northern CA (3), central CA (4), and southern CA (5). Lower colored panel indicates the % coverage within each subregion that is in heatwave status. View detailed information about these individual regions, including interactive plots and a variety of LMH indicator outputs.
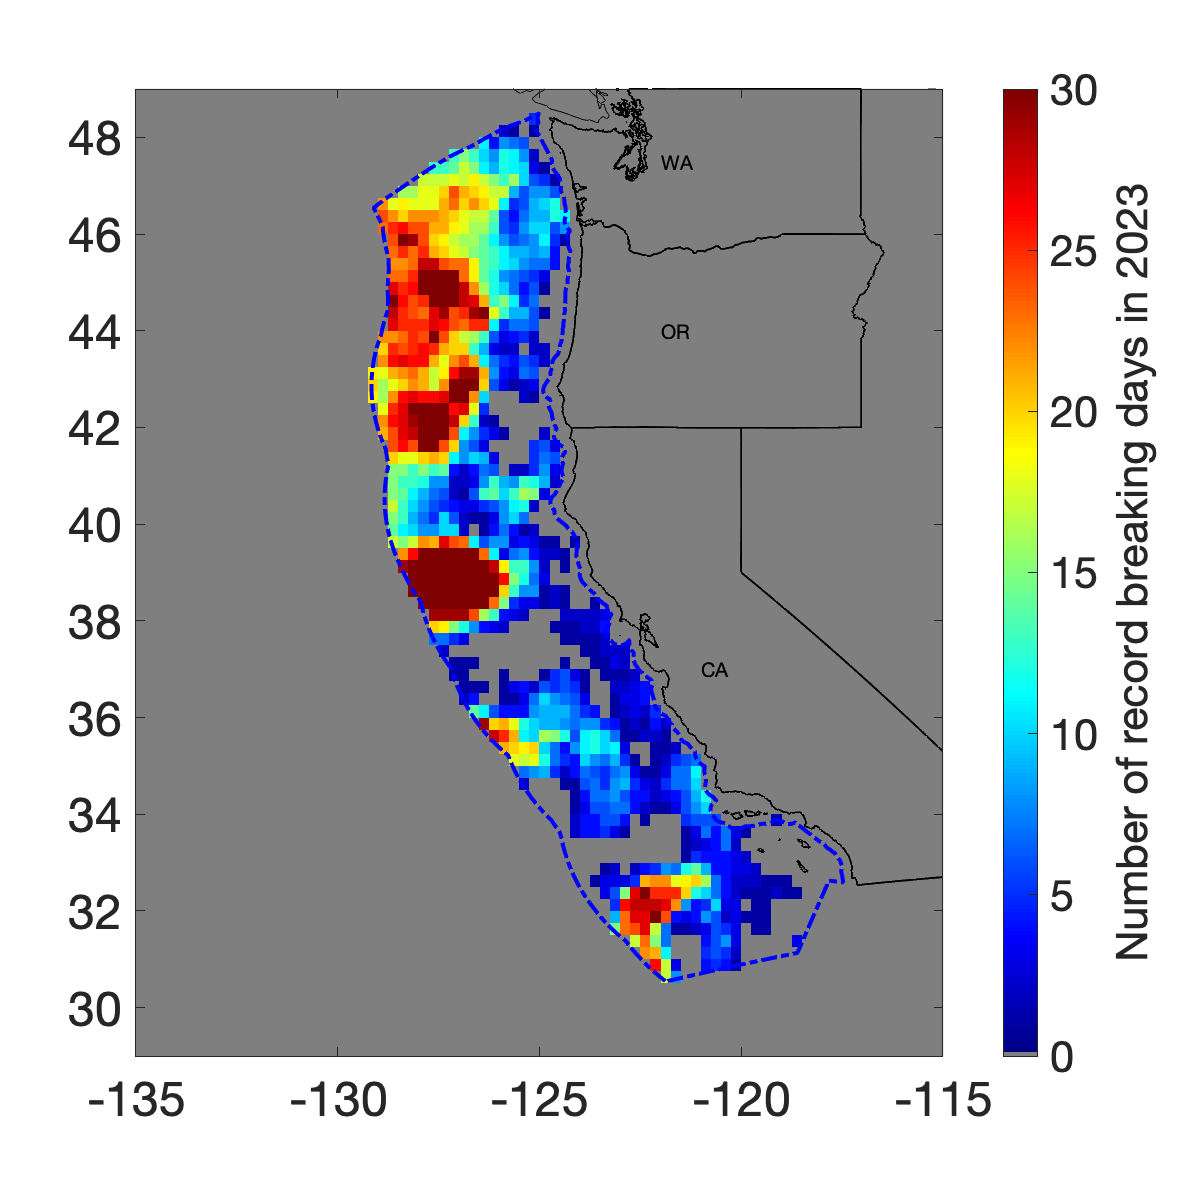
Figure 6: Number of sea surface temperature record-breaking days at each location during 2023. “Record breakers” were defined as any location where the temperature on a specific day is higher than the previously recorded temperature at that location for that specific day of the year. Grey indicates no records were broken at that location. Dark red indicates 30 or greater days of record breakers during 2023 at a given location (the maximum number of record breaking days for a single location was 72 days in the waters off northern CA, Fig. 8).
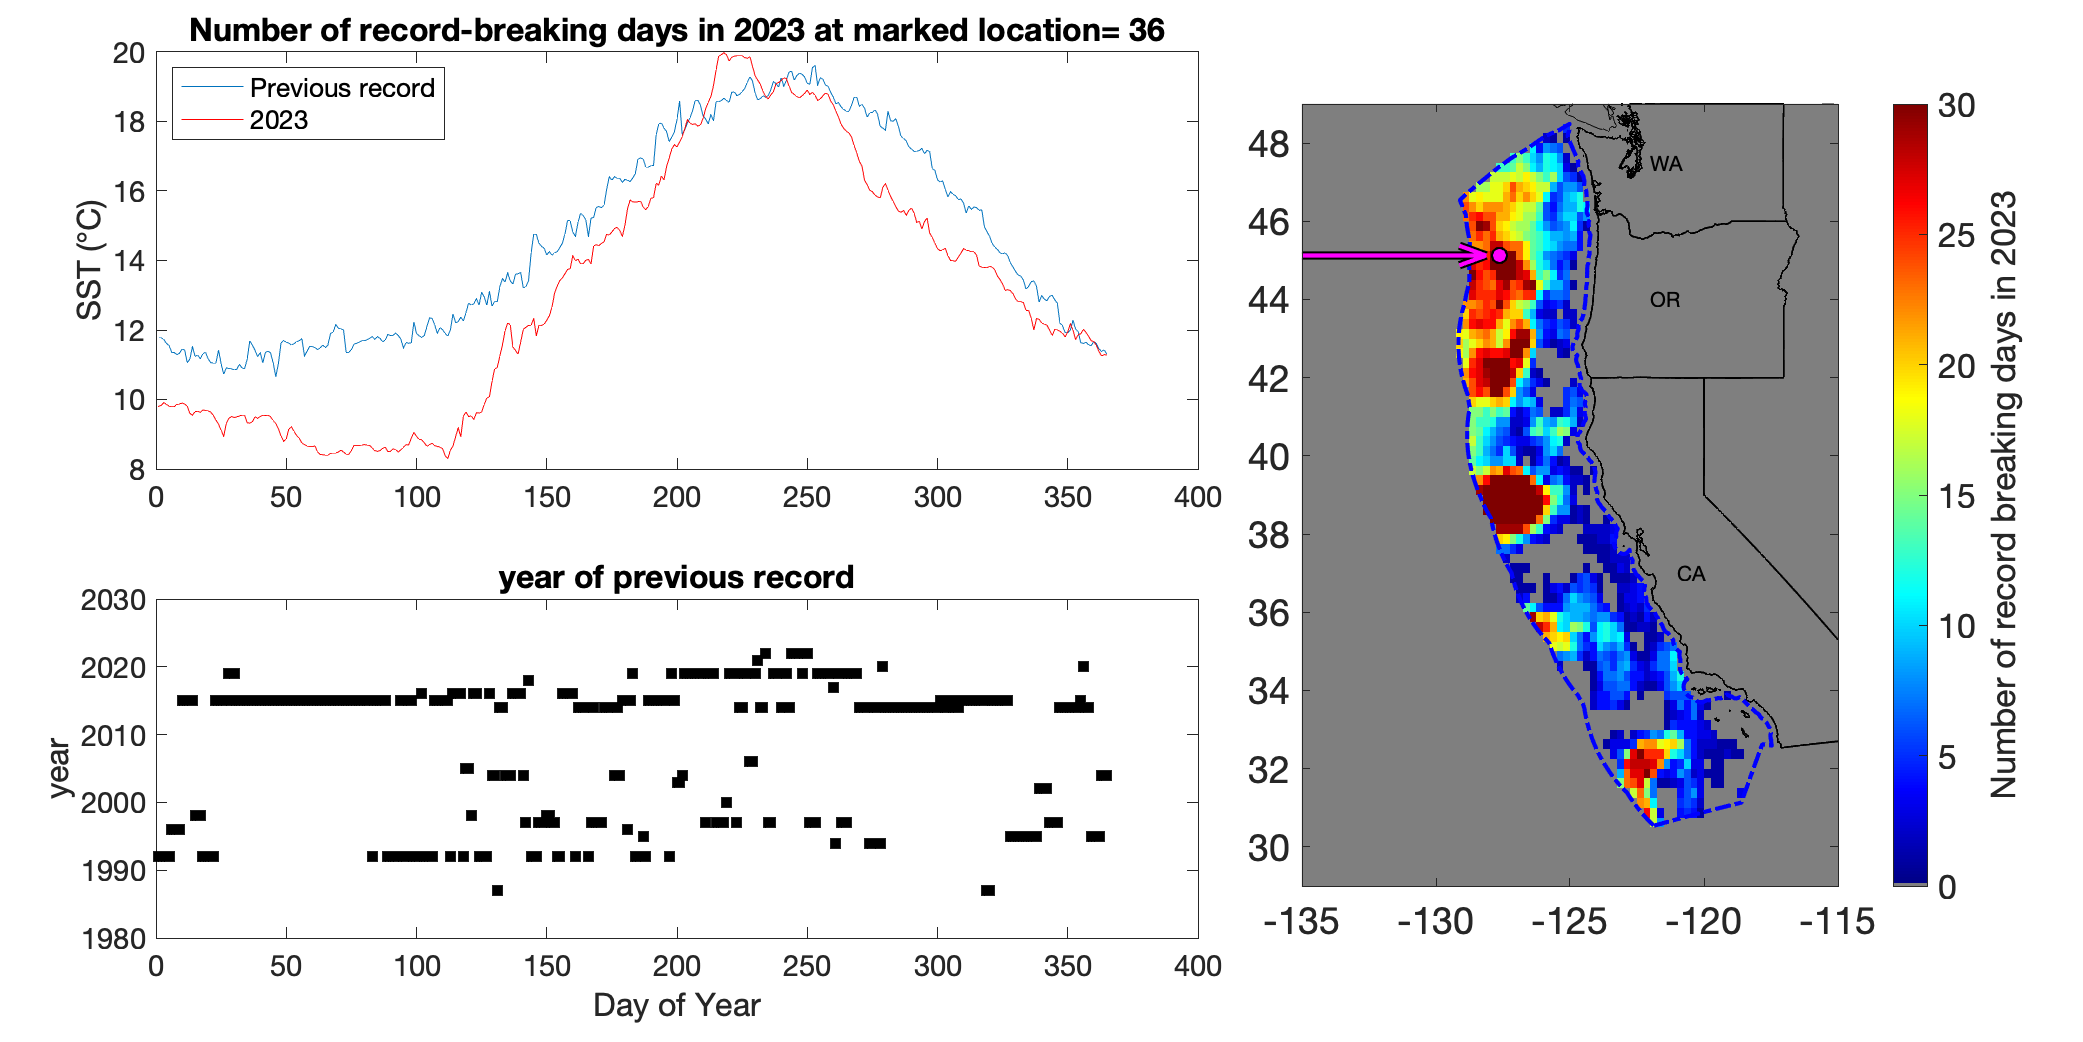
Figure 7: Number of sea surface temperature record breaking days at each location during 2023 (right) along with a time series of the past SST record, and the SST for 2023 (top left) and year when previous records were set (bottom left) for an indicated location (arrow to map) representative for the offshore region of WA/OR.
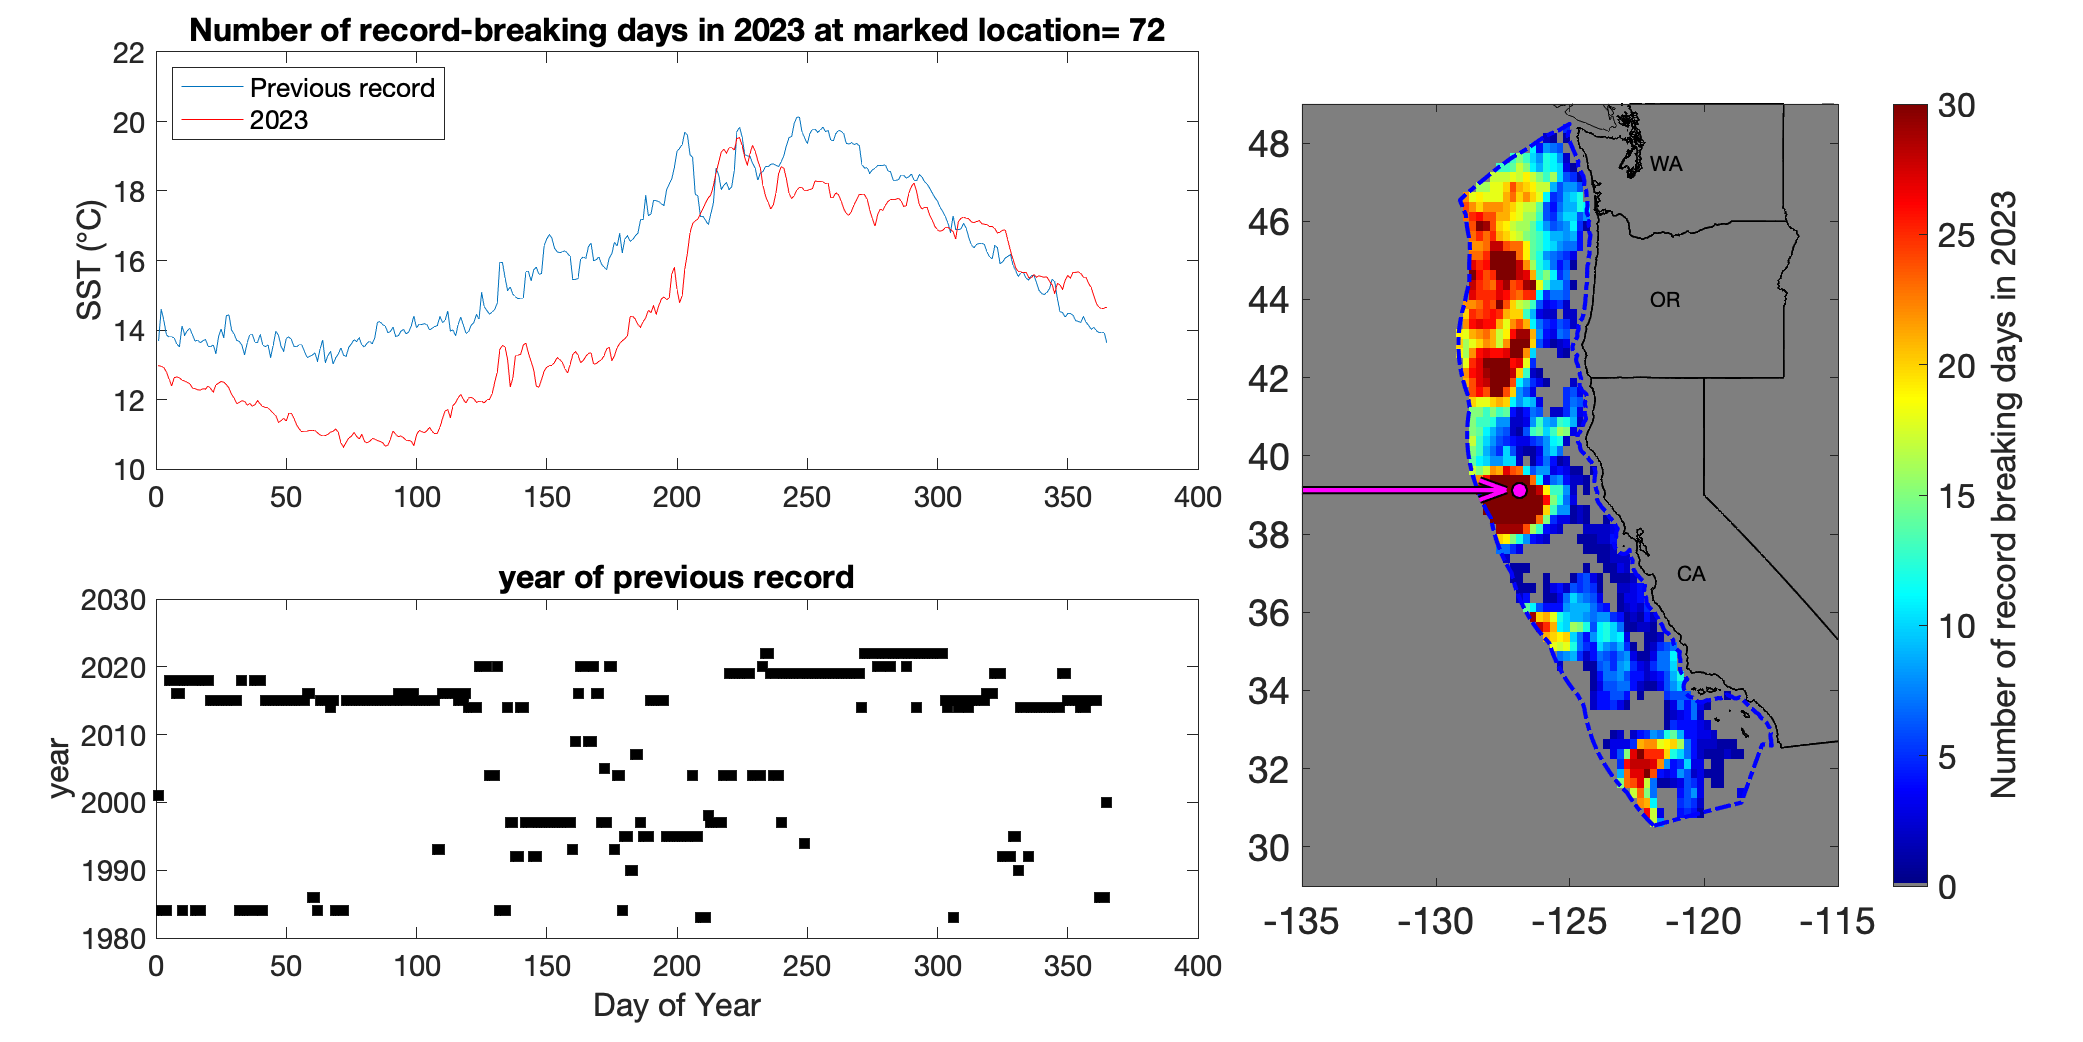
Figure 8: Number of sea surface temperature record breaking days at each location during 2023 (right) along with a time series of the past SST record, and the SST for 2023 (top left) and year when previous records were set (bottom left) for an indicated location (arrow to map) representative for the offshore region of northern CA.
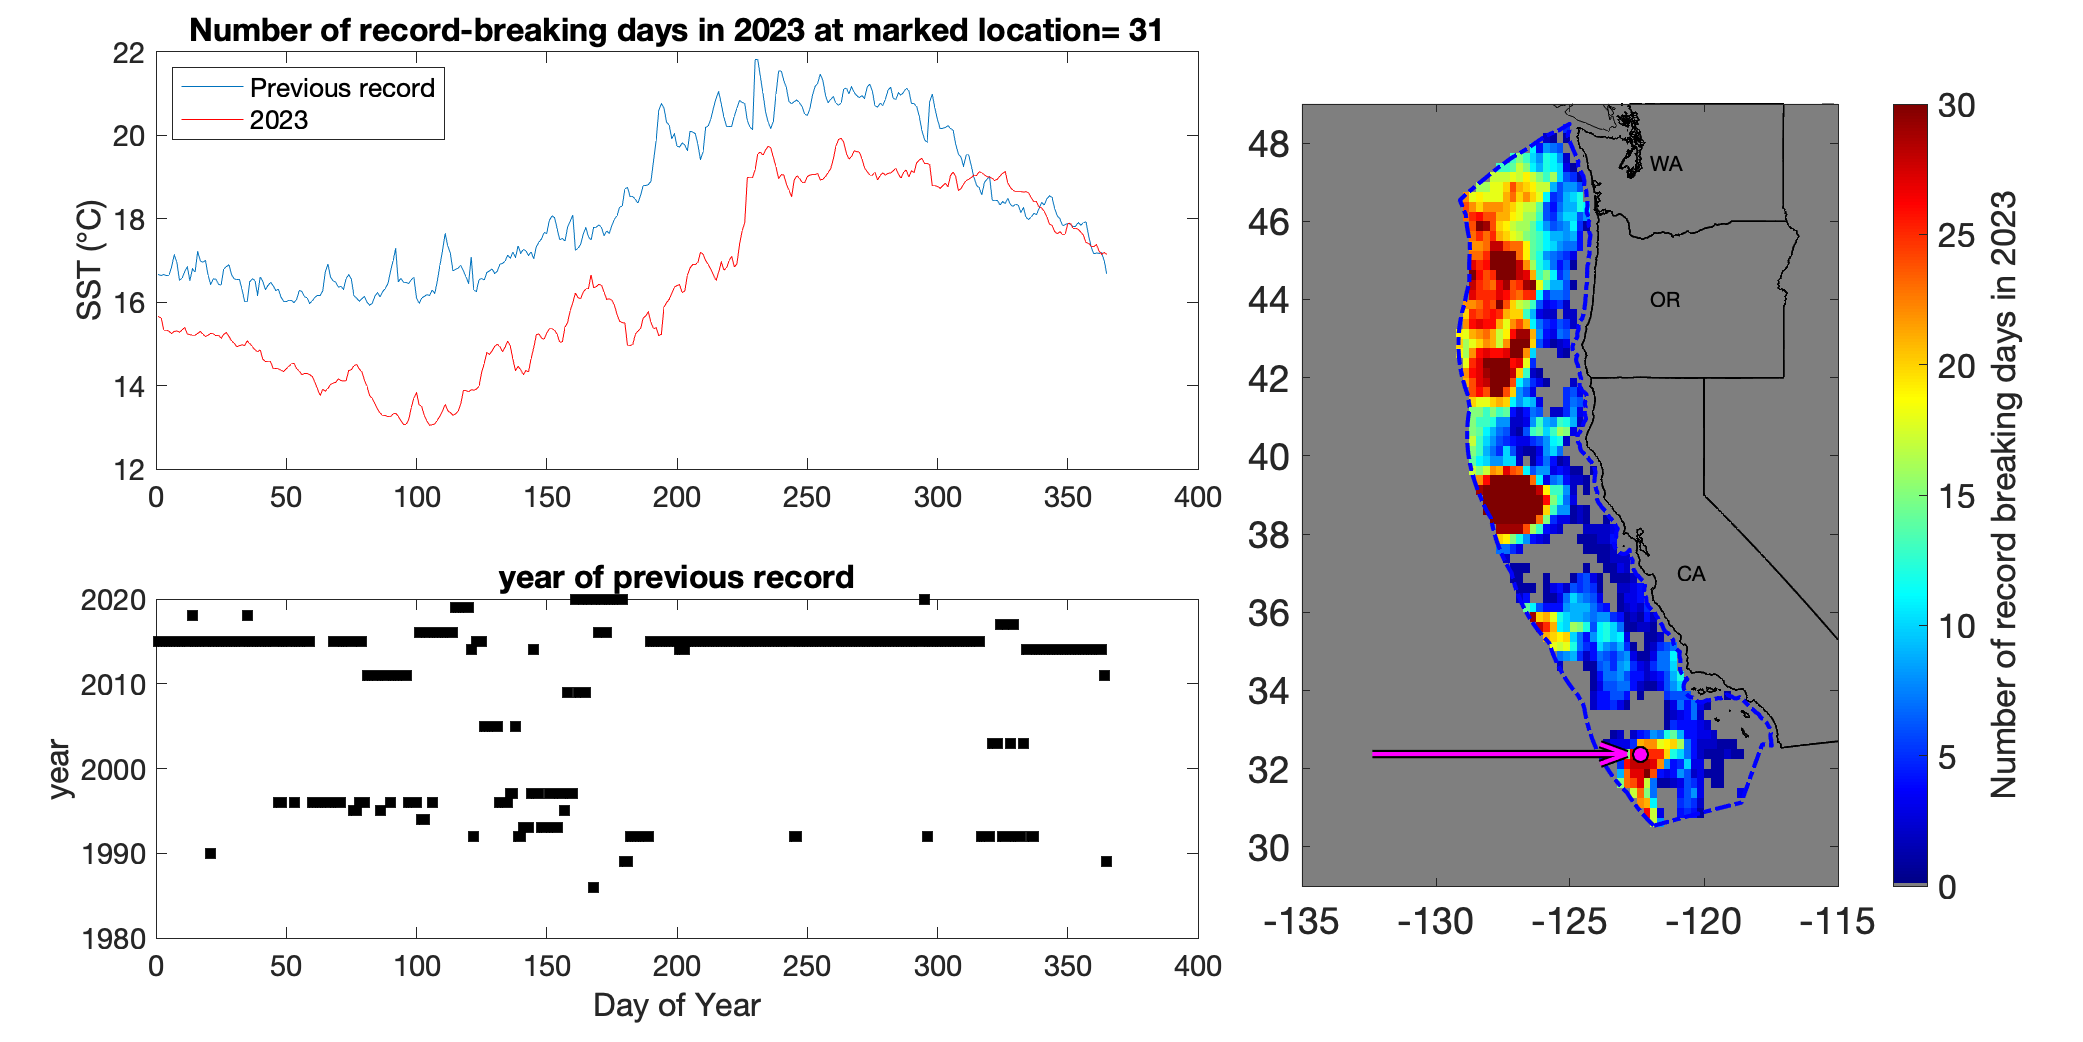
Figure 9: Number of sea surface temperature record breaking days at each location during 2023 (right) along with a time series of the past SST record, and the SST for 2023 (top left) and year when previous records were set (bottom left) for an indicated location (arrow to map) representative for the offshore region of southern CA.