2026-27 El Niño and Marine Heatwave Updates
Last updated 9/25/2026. (This page is updated monthly.)

Last updated 9/25/2026. (This page is updated monthly.)
The latest report from the NOAA Climate Prediction Center (CPC) states that El Niño conditions are present and expected to strengthen into the Northern Hemisphere during winter 2026-27. Model forecasts suggest a > 90% chance of a "very strong" El Niño during November 2026 - January 2027 that would rank among the strongest events in the historical record going back to 1950 (Fig. 1). Impacts from El Niño, such as warmer-than-normal water temperatures, will likely be felt throughout the U.S. West Coast from fall through winter and potentially into spring.
Some portions of the coastal region along the U.S. West Coast, particularly off central and southern California, continue to be impacted by marine heatwave NEP25A which we have tracked since May 2025. Similar to past years, another separate marine heatwave, NEP26A, has developed far offshore (Fig. 2) and is not impacting the coastal region yet. It is important to note that neither of the current marine heatwaves are directly due to El Niño forcing, although we do anticipate that additional warming along the coast is likely to occur within the next few weeks due to El Niño-forced, coastally-trapped, internal waves (i.e., Kelvin waves).
The current marine heatwave forecast (an experimental product of the NOAA Physical Sciences Laboratory) suggests a high likelihood (80-100%) of marine heatwaves off the California coast through the end of 2026, with lower but still elevated likelihoods (30-70%) off Oregon and Washington (Fig. 3). These high likelihoods can be attributed to forcing from El Niño, occurring on the heels of the pre-existing southern California marine heatwave (NEP25A) described above.
We have seen back-to-back heat events in the past. For example, the "Blob" of 2014-2015 was followed by one of the largest recorded El Niño events (winter 2015-2016) on record. As a result, the California Current Ecosystem experienced over 700 continuous days of high temperatures. From these past events, we have all learned a lot about the potential impacts of El Niño on our fisheries and protected species.
For our local fisheries, the dominant feature which controls coastal water temperatures in the California Current system (where most of our fisheries occur) is upwelling, which is a process whereby winds from the north bring cold, nutrient-rich waters to the surface along the coast. The working hypothesis is that much of the timing and occurrence of large marine heatwaves within the U.S. West Coast Exclusive Economic Zone (EEZ) are related to changes in the winds driving upwelling: strong winds keep warm waters offshore, weak winds allow surface waters to warm and/or offshore waters to move in towards the coast. For example, strong winds led to the upwelling of cool water along the coast and kept warm waters at bay in 2025. However, the presence of El Niño-related marine heatwaves can decrease the effectiveness of upwelling, regardless of wind patterns, as these heatwaves extend much deeper into the water column along the coast.
The upwelling indices CUTI and BEUTI measure the extent of vertical transport (measured in meters/sec) into/out of the surface waters (CUTI) and the more biologically-relevant amount of nitrate flux in the upwelled / downwelled waters (BEUTI). Currently, CUTI and BEUTI both have average to slightly below-average values for this time of year, meaning that nutrient supply to the surface is average (Fig. 4).
NOAA's Northwest and Southwest Fisheries Science Centers are looking for industry input, with a focus on unusual or unexpected conditions observed during the 2026 fishing season. This information will help to better inform management, particularly for times and locations when current sampling efforts are limited. Examples of helpful observations include:
Are operating costs and the overall level of effort and participation for your focal fisheries different this year as compared to previous years? Have any new challenges or obstacles emerged?
If you have any unusual or unexpected conditions to report, please send the information to: CaCurrent.Observations@noaa.gov
Learn more about how your observations can help advance ecosystem science efforts at NOAA.

Figure 1. Latest monthly NOAA ENSO Strength Probability bar graph, from the NOAA Climate Prediction Center. Access the full ENSO diagnostic discussion and bar graph here.

Figure 2. Daily sea surface temperature anomalies (SSTa) in the California Current ecosystem. Color represents SSTa, with the thick black line encircling regions which are in "heatwave status"; arrows represent wind speed and direction; thin lines represent atmospheric pressure at sea level. Blue dashed line represents the US West Coast exclusive economic zone (EEZ). SST data from Multi-scale Ultra-high Resolution (MUR) SST Analysis Anomaly; sea level pressure and wind data from NCEP/NCAR Reanalysis. Figure originally presented on the CCIEA Marine Heatwave Tracker.
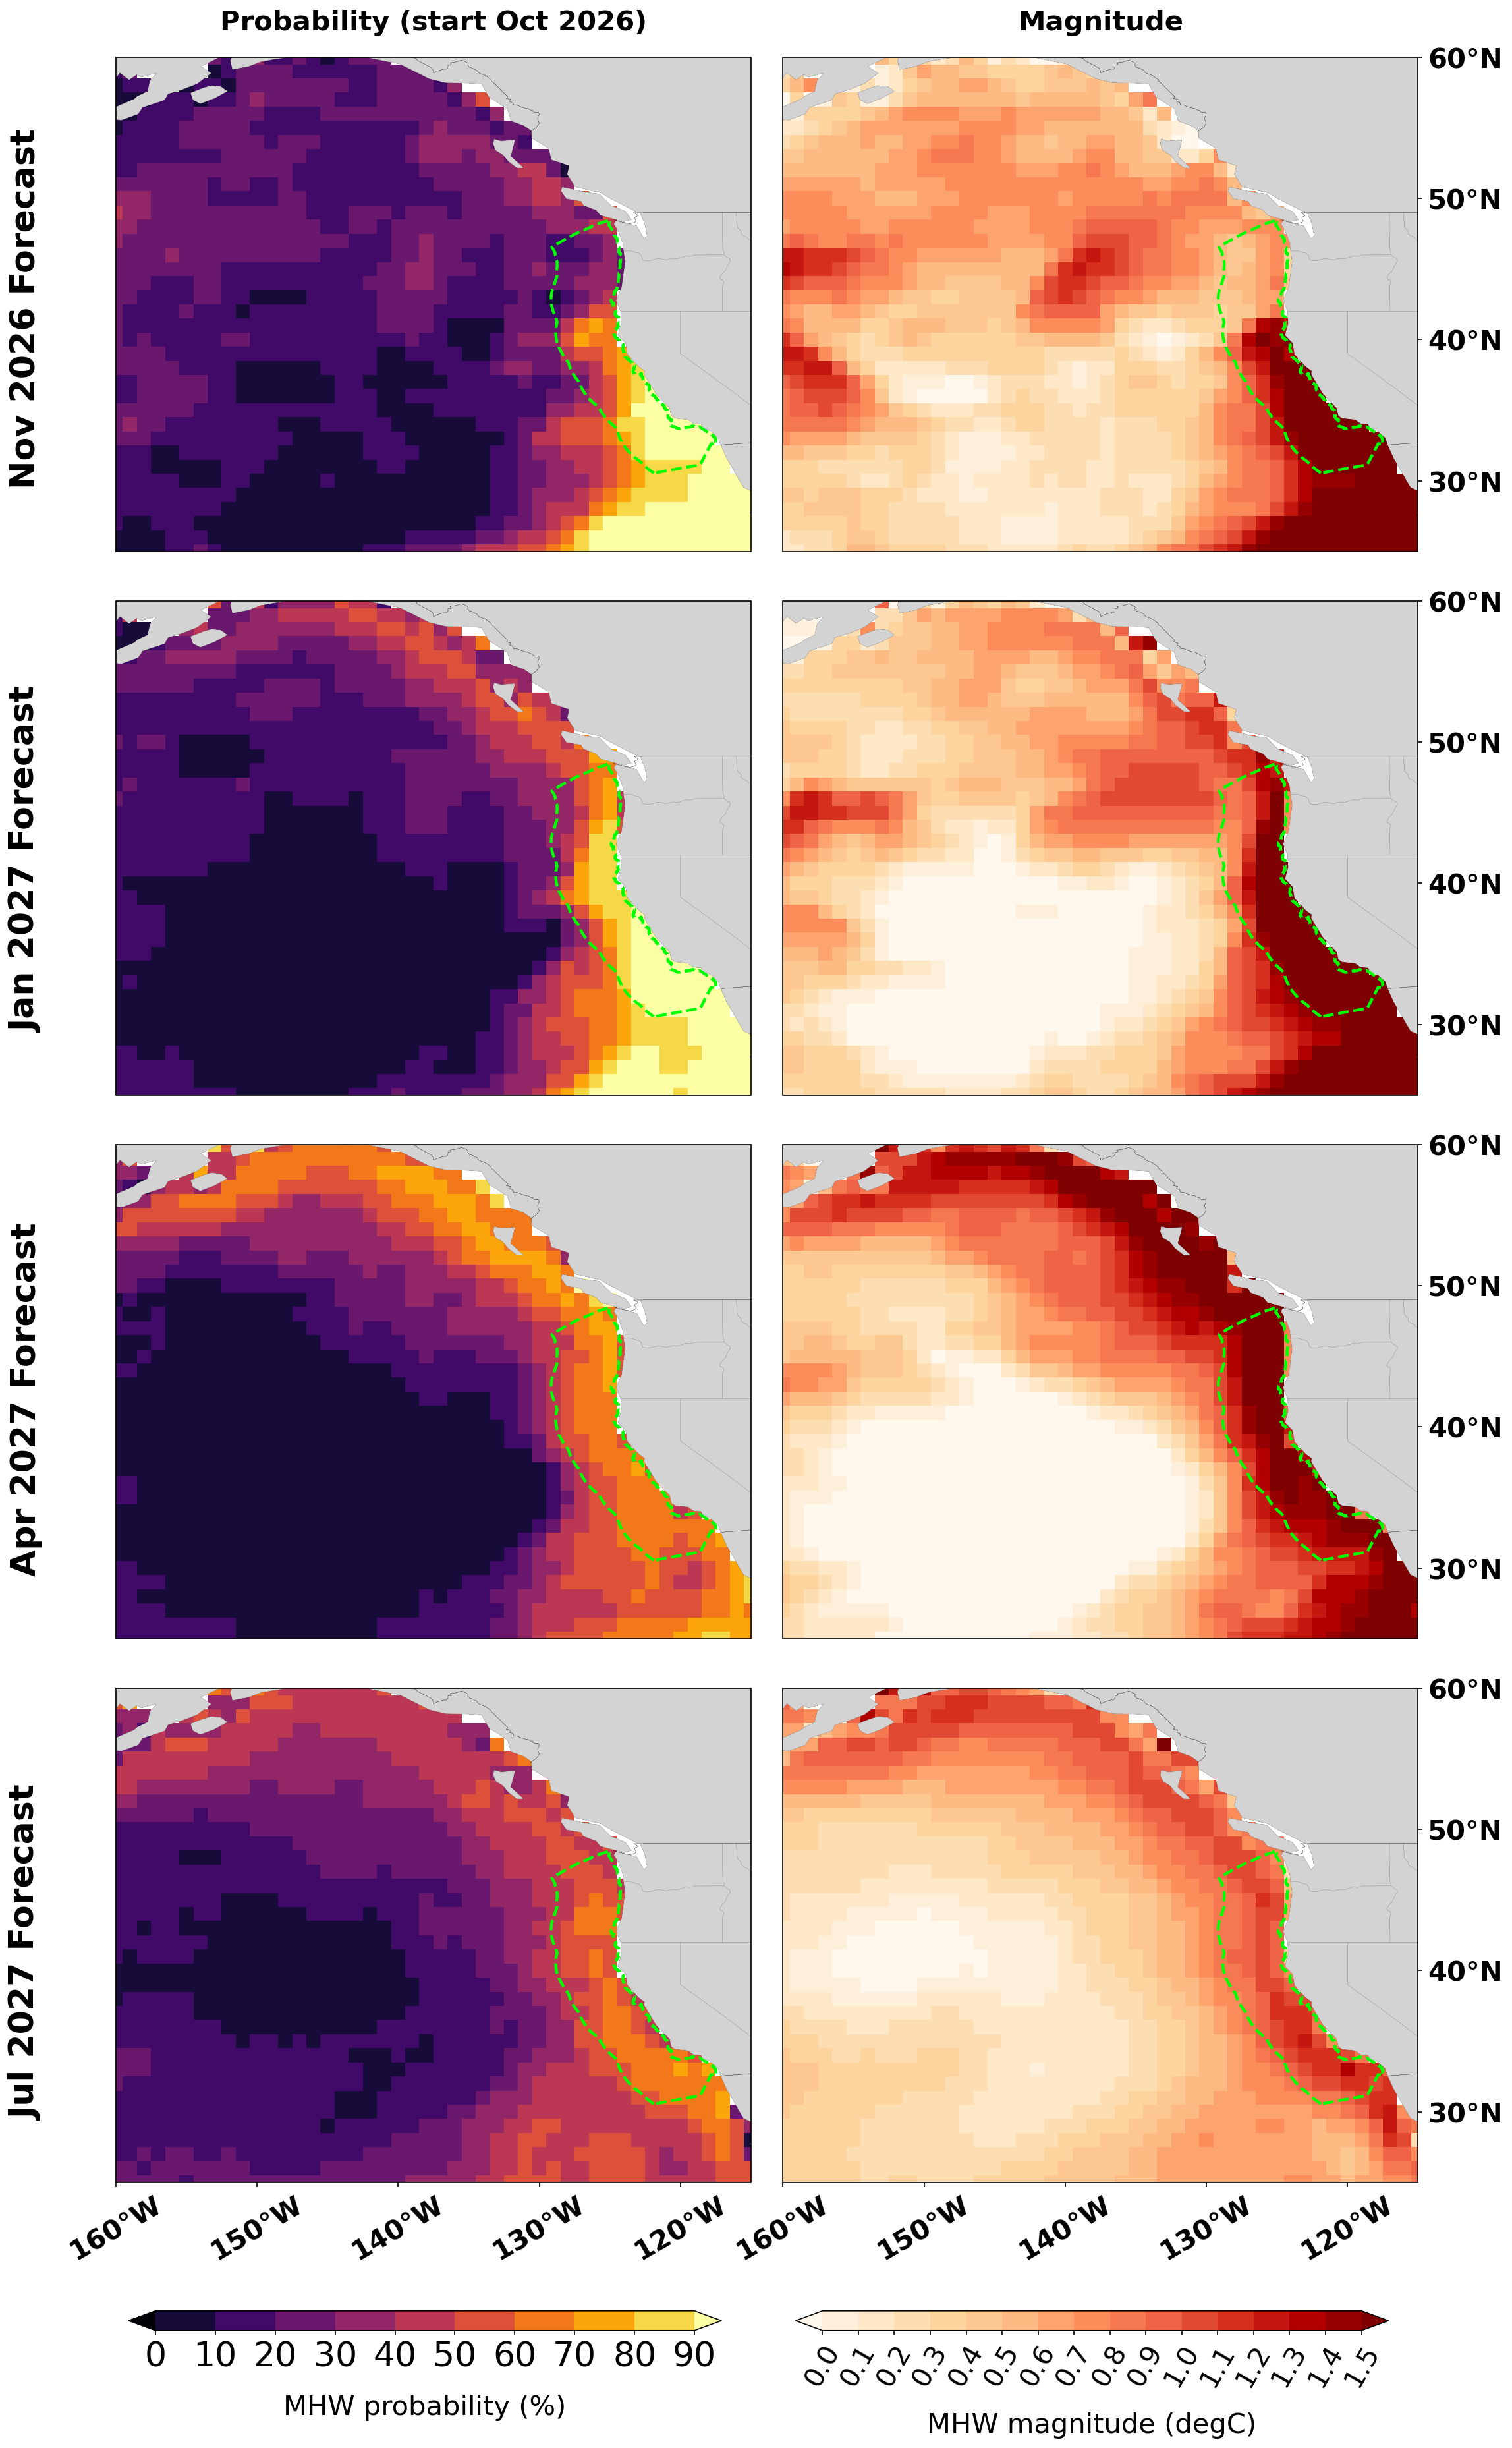
Figure 3. Latest quarterly marine heatwave forecast maps for the northeast Pacific including the U.S. West Coast EEZ. Note: this is an experimental product from the NOAA Physical Science Laboratory's global marine heatwave forecast discussion monthly report.
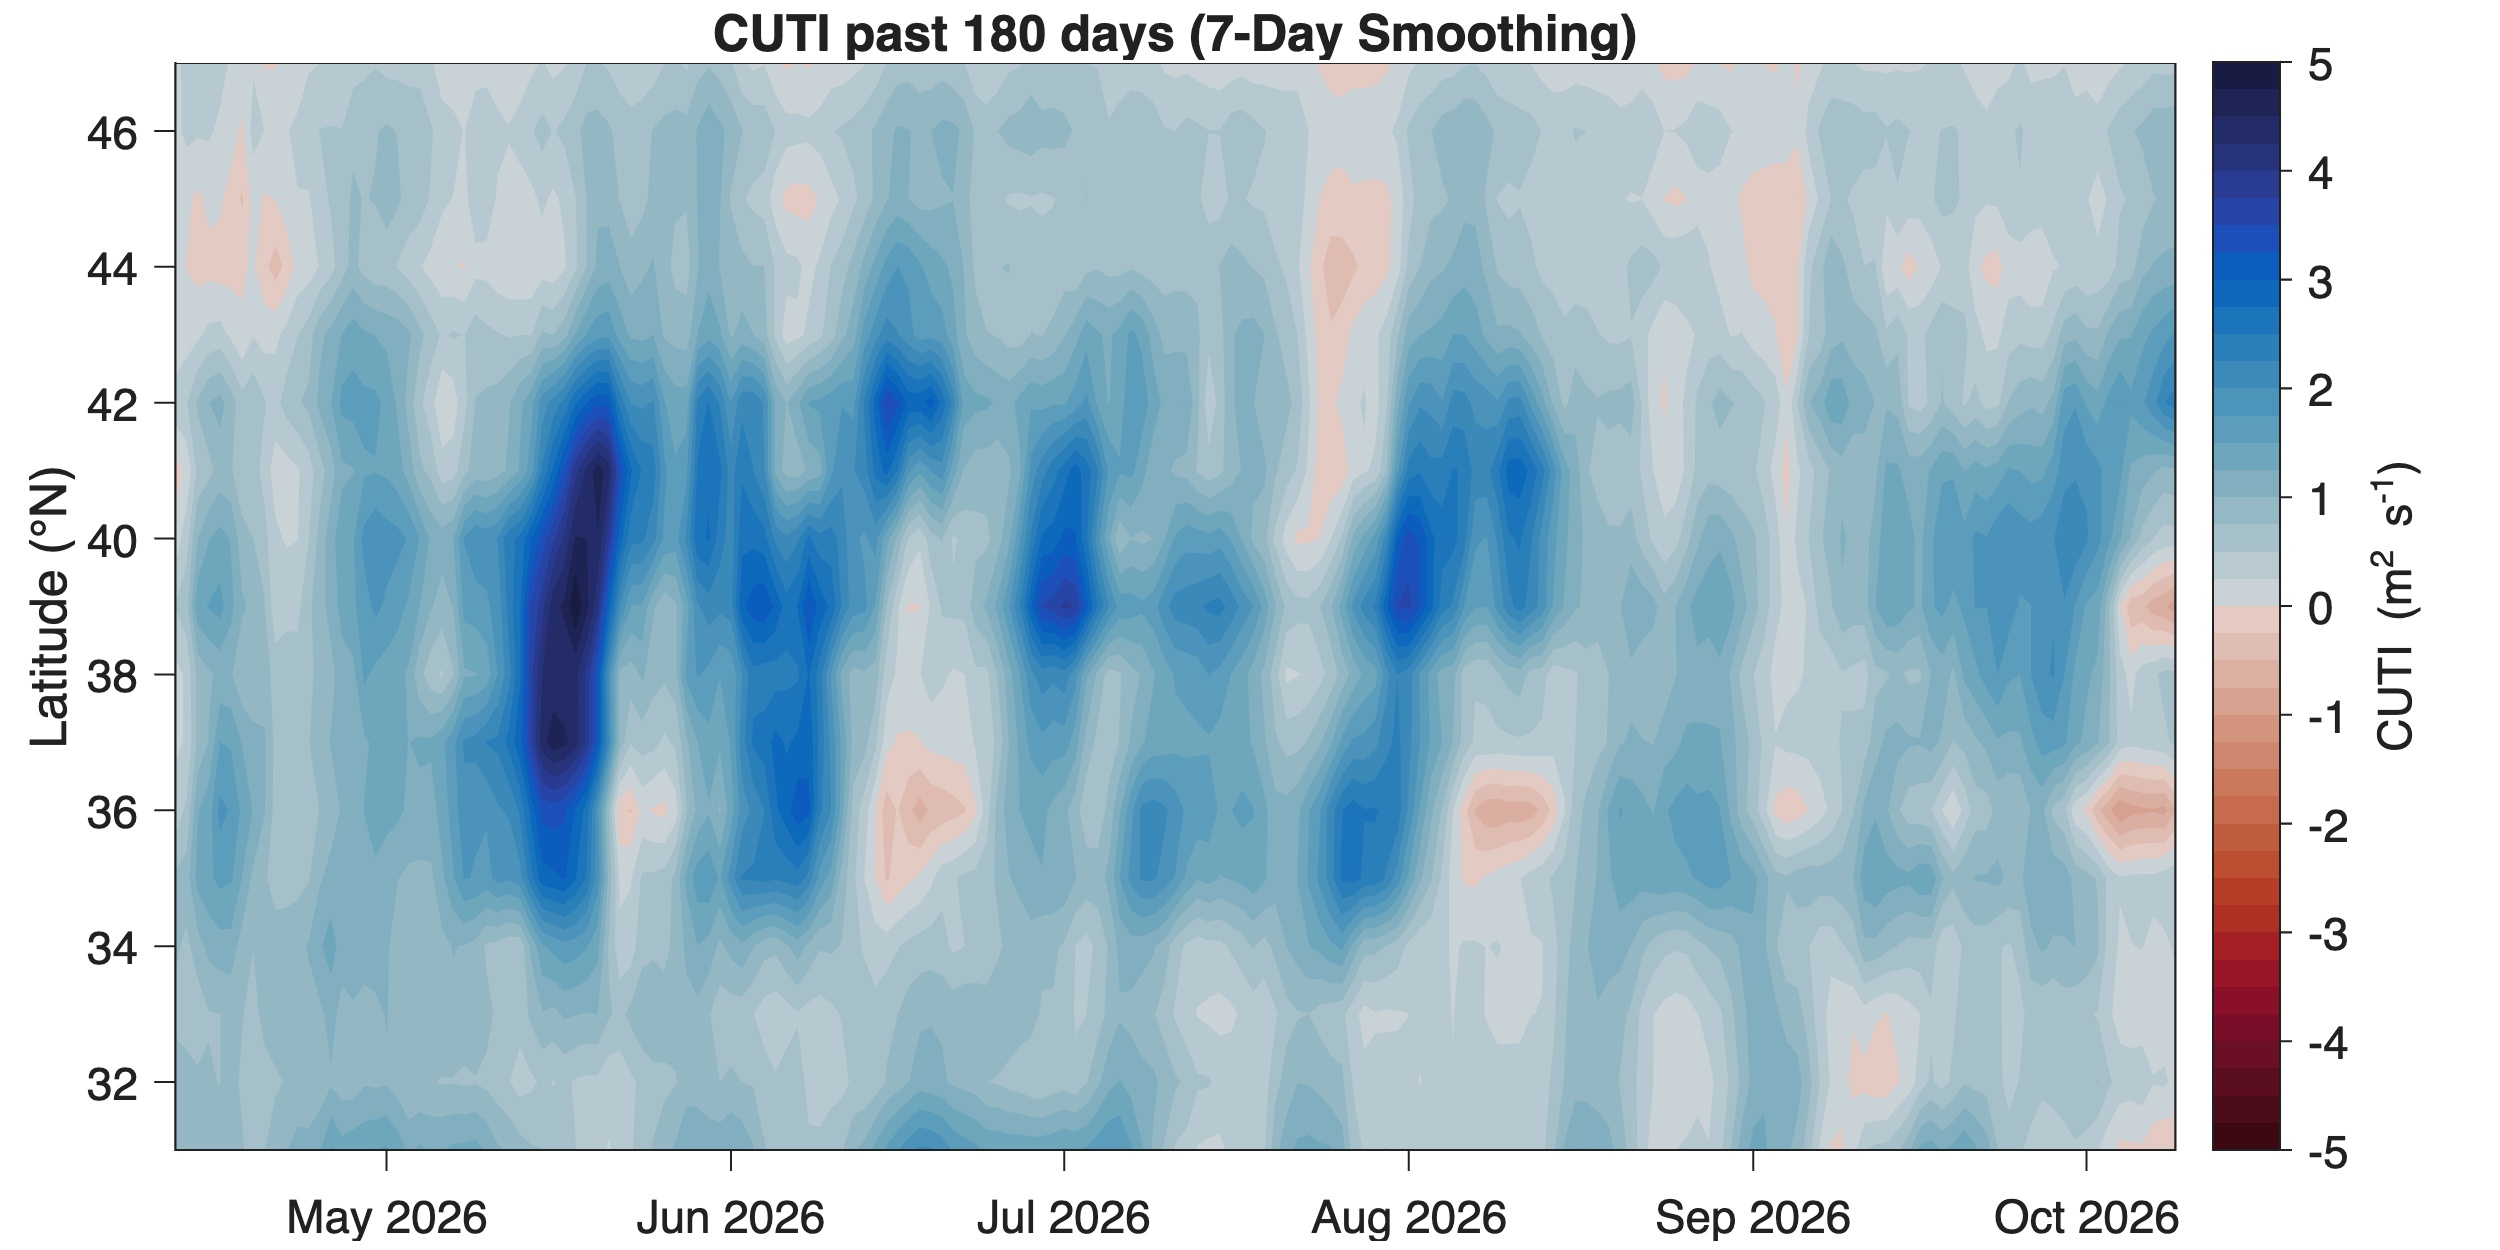
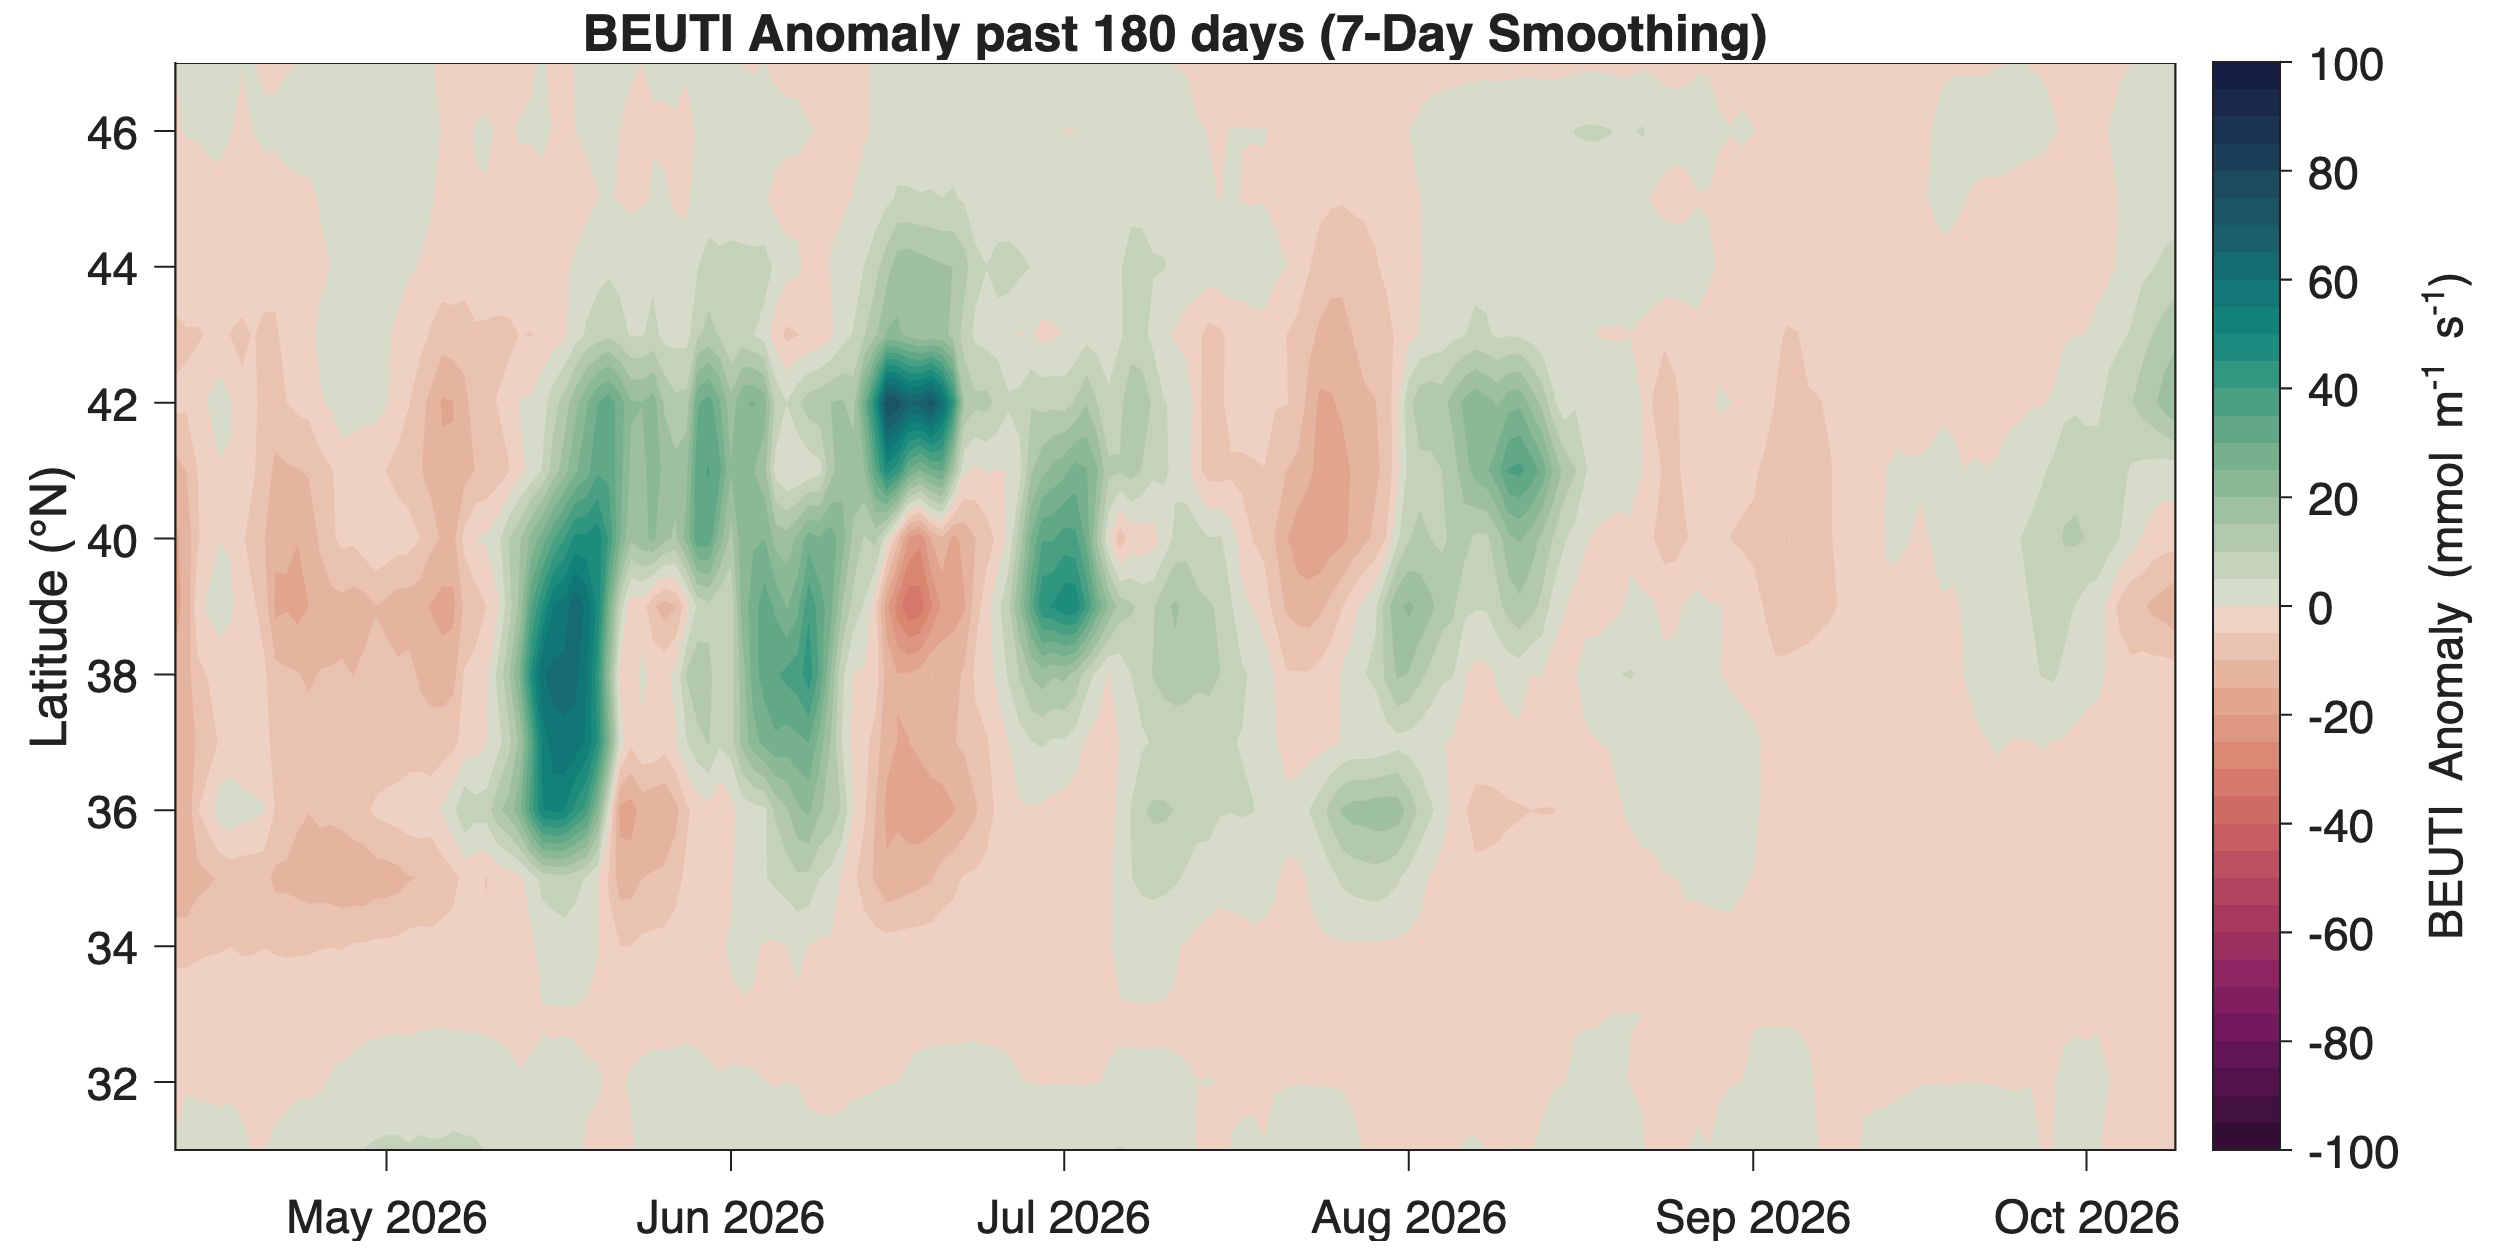
Figure 4. CUTI and BEUTI upwelling indices for the U.S. West Coast (past 180 days with 7-day smoothing).
Marine heatwaves, or MHWs, occur when ocean temperatures are much warmer than usual for an extended period of time; they are specifically defined by the difference between the current temperature and the expected temperature for a specific location and time of year. Because of their effects on ecosystem structure, biodiversity, and regional economies, scientists from around the world are growing the portfolio of research on MHWs.
In 2014, the MHW eventually known as "The Blob", began dominating the northeast Pacific Ocean and persisted until mid-2016. Researchers documented many ecological effects associated with “The Blob”, including unprecedented harmful algal blooms, shifting distributions of marine life, and changes in the marine food web.
Since then, marine heatwaves in the California Current region have now occurred in each of the last seven years (2019 - 2025). They typically begin during the spring in the far offshore region of the open North Pacific, move toward and impact the US West Coast during the fall, and finally terminate during late winter. Of the last seven years, six of these were among the largest heatwaves on record since monitoring began in this region since 1982.
During normal conditions in the Pacific Ocean, trade winds blow west along the equator, taking warm water from South America towards Asia. To replace that warm water, cold water rises from the depths — a process called upwelling. El Niño and La Niña are two opposing climate patterns that break these normal conditions. Scientists call these phenomena the El Niño-Southern Oscillation (ENSO) cycle. El Niño and La Niña can both have global impacts on weather, wildfires, ecosystems, and economies. Episodes of El Niño and La Niña typically last nine to 12 months, but can sometimes last for years. El Niño and La Niña events occur every two to seven years, on average, but they don’t occur on a regular schedule. Generally, El Niño occurs more frequently than La Niña.
During El Niño, trade winds weaken. Warm water is pushed back east, toward the west coast of the Americas. El Niño can affect our weather significantly. The warmer waters cause the Pacific jet stream to move south of its neutral position. With this shift, areas in the northern U.S. and Canada are dryer and warmer than usual. But in the U.S. Gulf Coast and Southeast, these periods are wetter than usual and have increased flooding.
El Niño also has a strong effect on marine life off the Pacific coast. During normal conditions, upwelling brings water from the depths to the surface; this water is cold and nutrient rich. During El Niño, upwelling weakens or stops altogether. Without the nutrients from the deep, there are fewer phytoplankton off the coast. This affects the zooplankton and fish that eat phytoplankton and, in turn, affects everything that eats them. The warmer waters can also bring tropical species, like yellowtail and albacore tuna, into areas that are normally too cold.
Ecological impacts from the combined effects of a MHW followed by a strong El Niño are difficult to fully anticipate. Based on observations during the most recent El Niño (2023-24), the CCIEA team assembled the following list of impacts, which can be thought of as the least extreme scenario for the upcoming forecast El Niño:
In 2015, the US West Coast experienced "The Blob", a MHW much larger in area than the current one. This MHW was followed immediately by a strong El Niño during the winter of 2015-16. That sequence of events is analogous to the current predicted situation, albeit with a larger MHW than now and a more moderate El Niño than the currently forecast one. Impacts of that event - "The Blob" followed by a moderately strong El Niño - are fairly well documented (Cavole et al. 2016, Leising et al. 2016, Free et al. 2023, Starko et al. 2025), and may represent the most extreme scenario for the currently forecast event. These impacts include:
Although it is too early to have quantitative results from recently conducted fisheries surveys, initial reports still provide some insight into the most current “on-the-water” conditions. It was noted from the May Juvenile Salmon and Ocean Ecosystem Survey (JSOES) cruise that overall juvenile salmon catch off the OR/WA coast appeared similar to the long term mean, with a high diversity of non-salmonid species and prey species. The Rockfish Recruitment and Ecosystem Assessment Survey (RREAS) survey off central CA noted high productivity of YOY anchovy and rockfish, but below average krill abundance; however, anecdotal observations from the Applied California Current Ecosystem Status Survey (ACCESS) survey program suggests krill may have been distributed in deeper waters. The California Cooperative Oceanic Fisheries Investigations (CalCOFI) spring cruise (March-April) between San Diego and San Francisco saw high productivity as measured by high abundances of sardine and anchovy eggs, regardless of the MHW there, and with high numbers of Velela velella to the south and pyrosomes to the north.